Recognising patterns in data can lead to significant insights and a competitive advantage. For instance, pattern recognition in patient data can predict outbreaks of diseases before they occur, allowing for timely interventions.
You know this from the world of social media. Ever noticed how cat videos dominate your feed after you watch just one? That’s pattern recognition at work, keeping you engaged. That one was forced upon you by your favourite social media platform.
But did you know that the human brain is programmed to look for patterns. You have probably also noticed that, soon after you bought that blue and grey top with a pie chart on it, only to discover that everyone seems to be wearing blue and grey tops with pie charts on.
(If you’ve never bought an outrageous data-joke enabled top, then good on you. But think back on your last car…I bet you saw a lot more of them on the roads soon after you got yours.)
Which is why its really important to help our users see and identify those patterns on your dashboards.
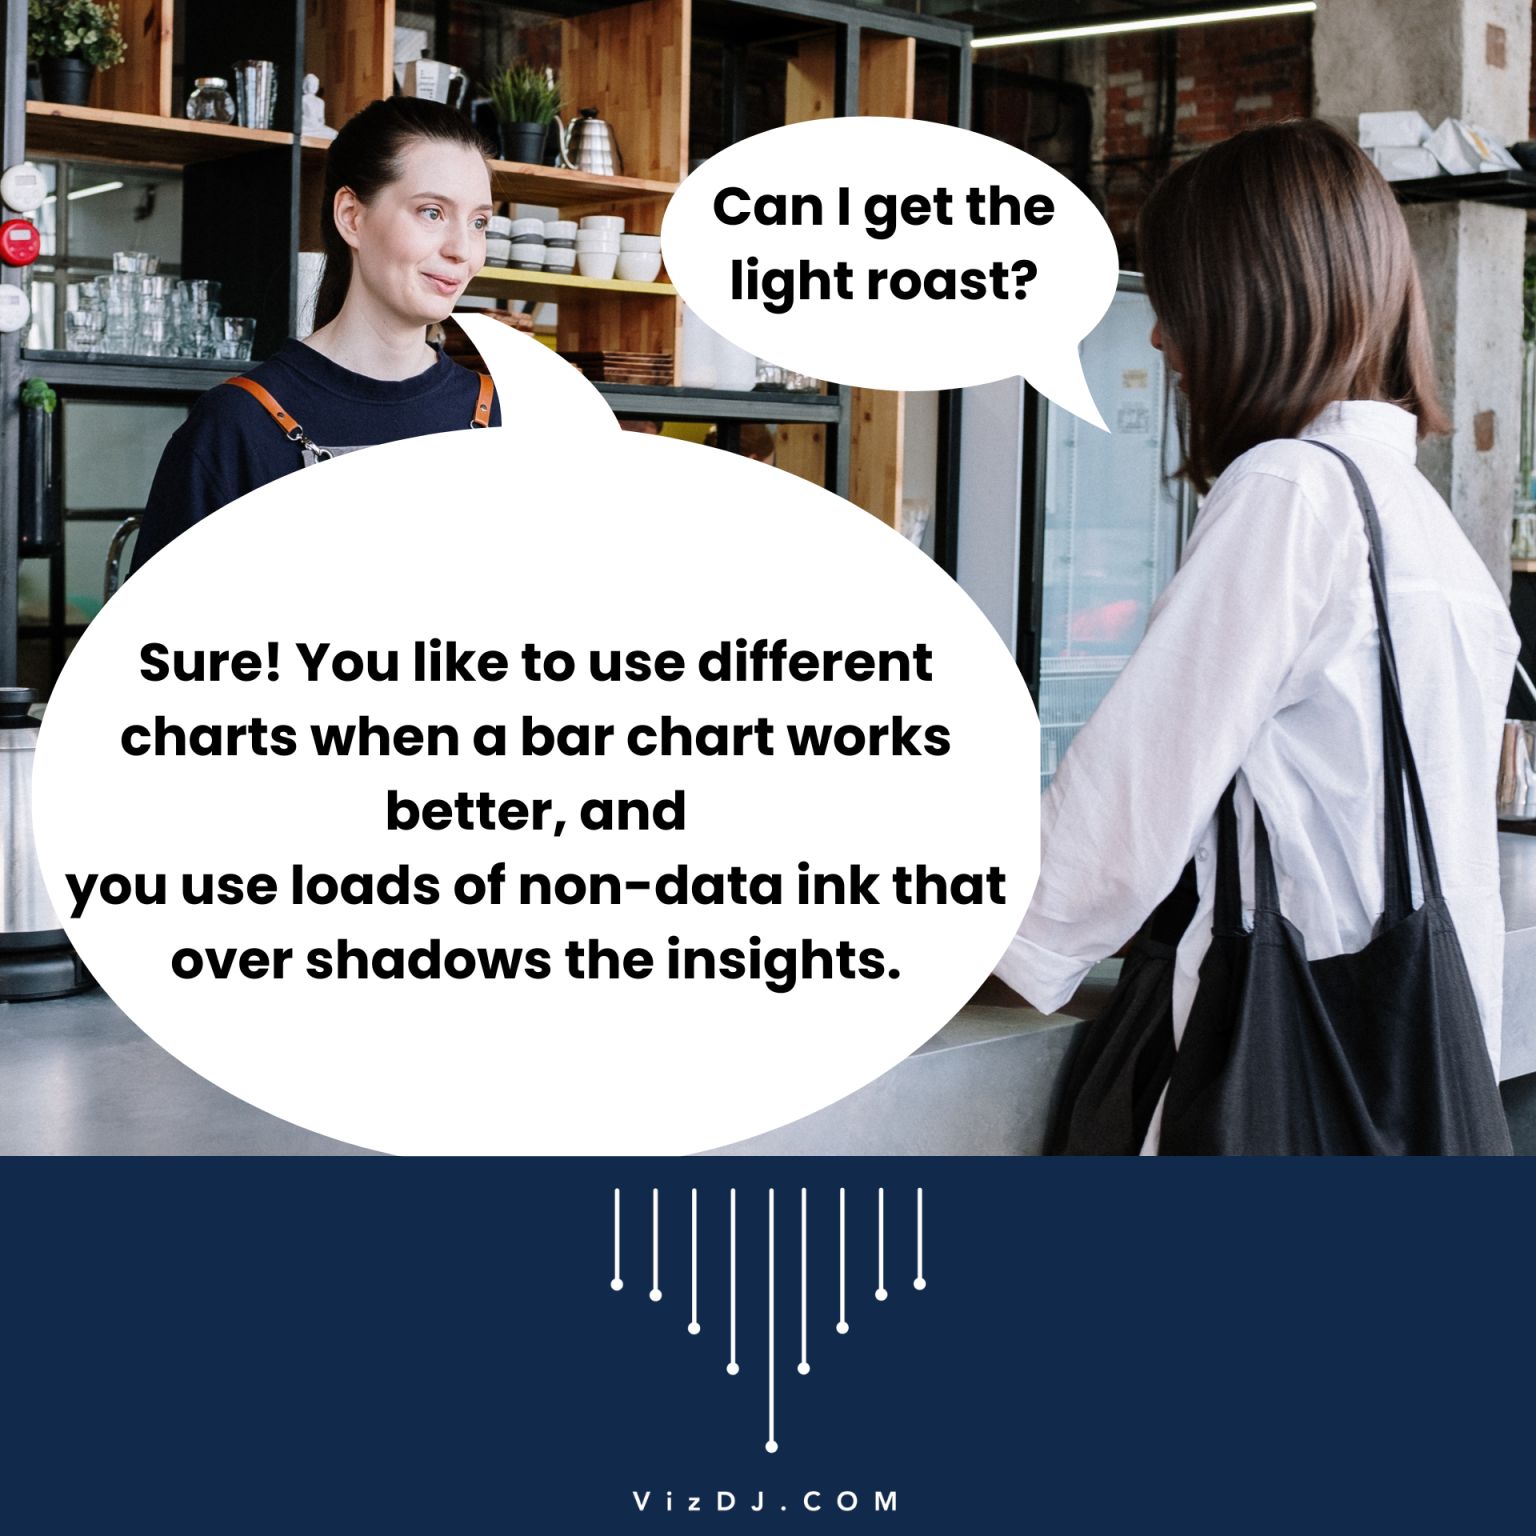
It’s why you hear people using phrases like “de-clutter” and “non-data ink” when talking about best practices in dashboard design.
Don’t wait for the barista to roast you. But do get someone else to review your work.
You know when you are finished, when there is nothing else to take away – not when there is nothing more to add.
🔍 “Patterns in data tell stories; it’s up to us to listen.”
🌟 What surprising or funny patterns have you found in your analysis?


