What’s more, this is a great chance to sharpen your visualisation muscles. Eric Balash’s post gives you the actual dataset (from a YouGov survey of over a thousand people) to follow along with, plus resources and examples for how to build Likert scales well. This is the kind of guided, example‑rich content that helps you do better, faster. It’s worth checking out.
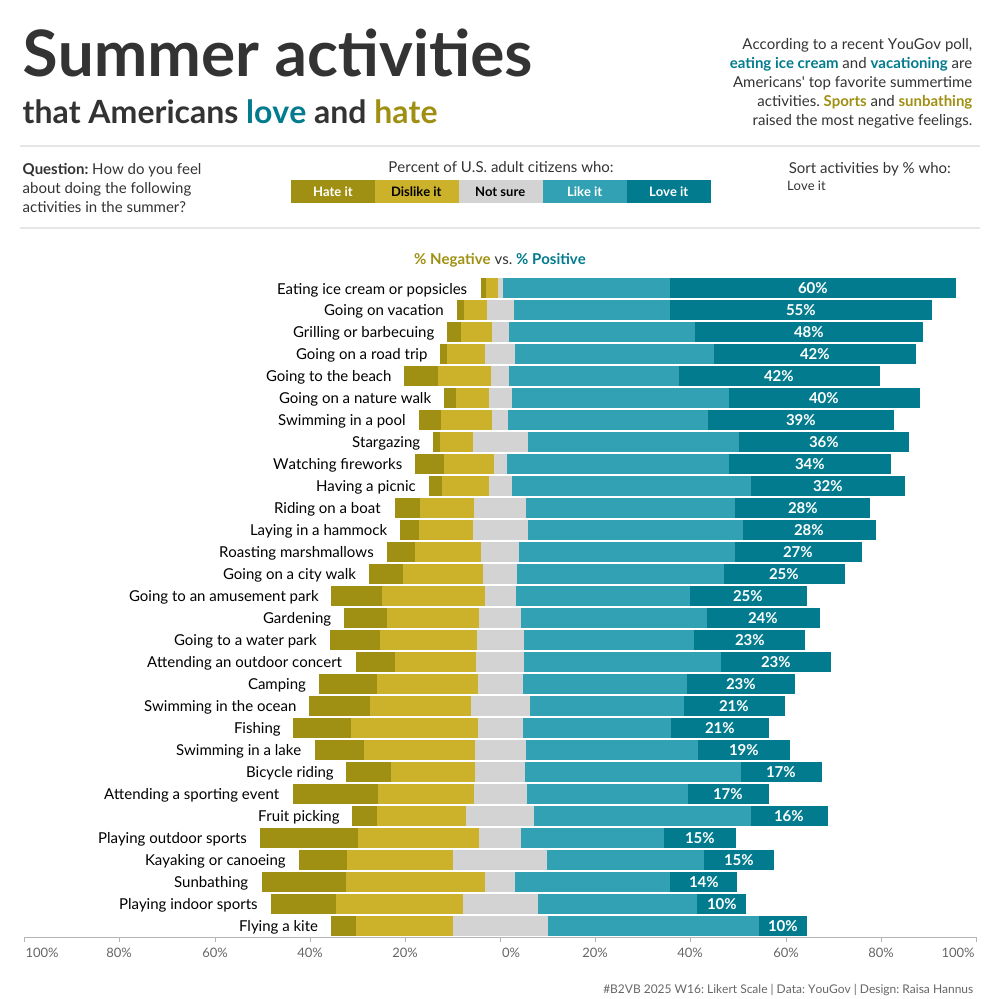

Tableau Training on
Tap Fast Track

Tableau Advanced Analyst

Tableau
Foundation

