Amy Esselman guides you through both the strengths and pitfalls of using choropleth maps. You’ll learn why they work best with normalis ed values (like rates or percentages), how colour scales influence perception, and what to watch out for so your audience doesn’t misinterpret the data — all framed with clear examples that bring the concepts to life.
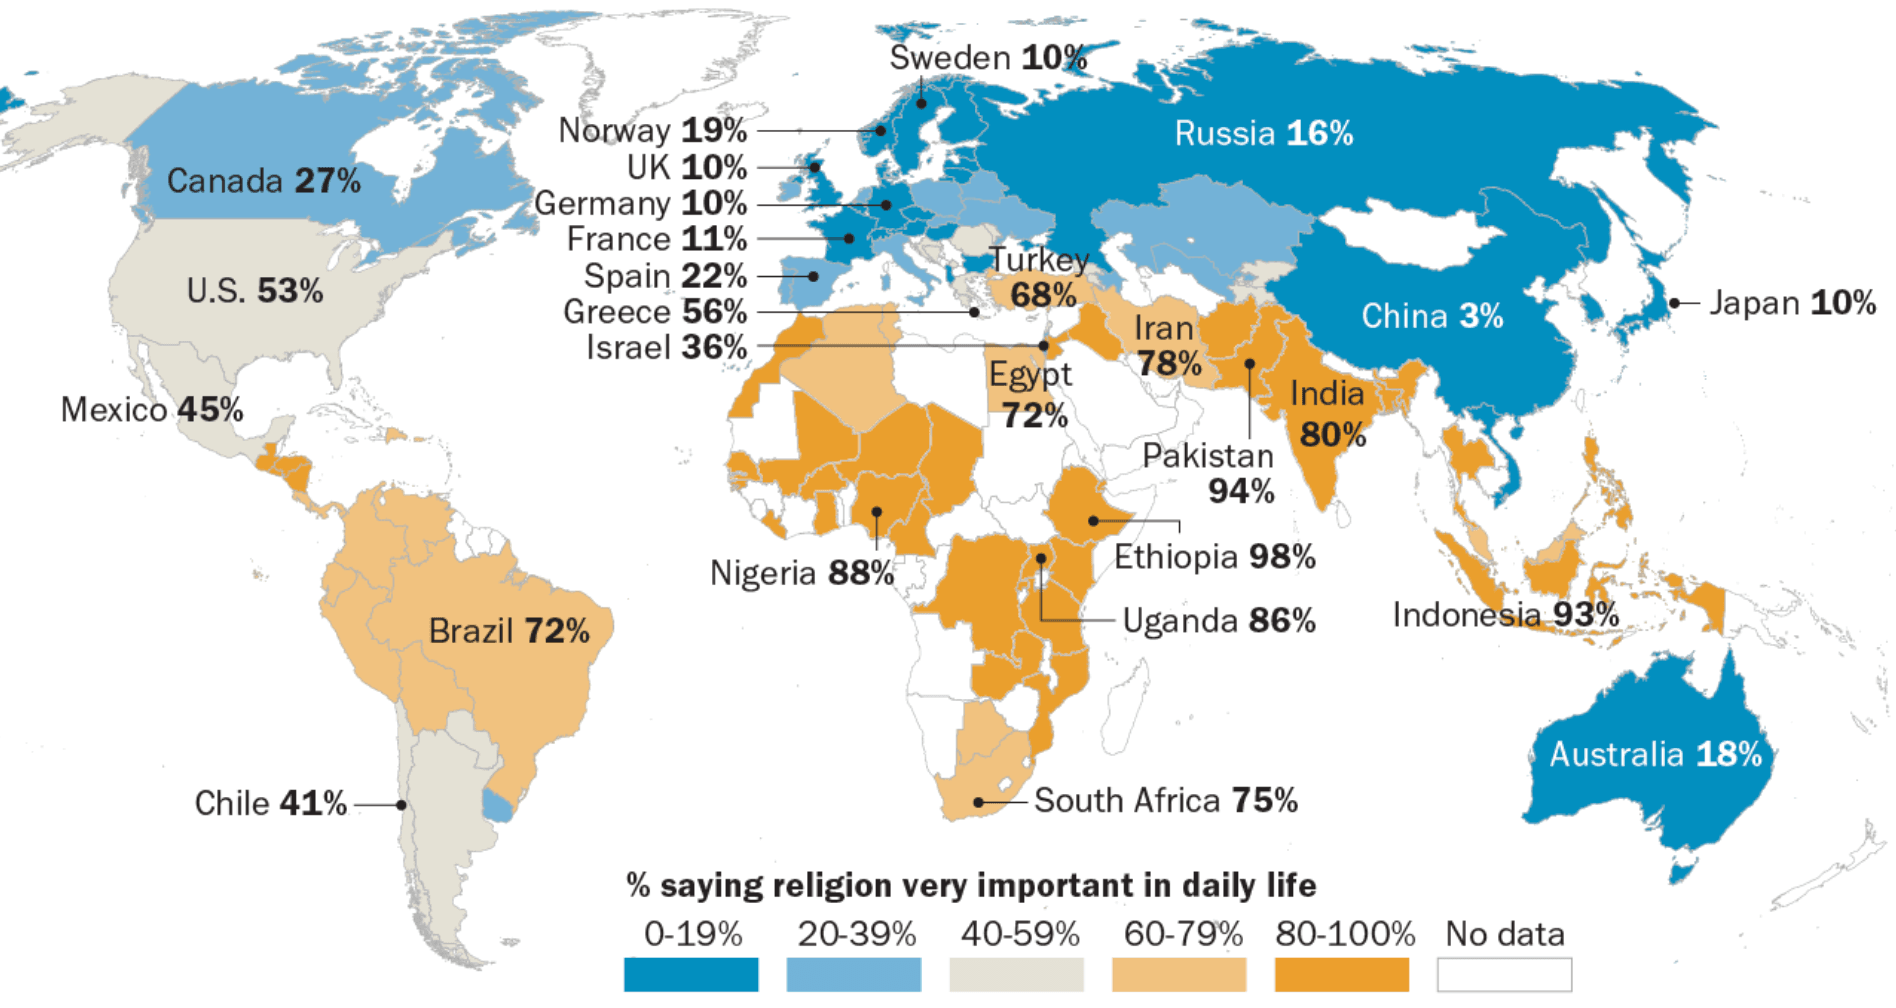

Tableau Training on
Tap Fast Track

Tableau Advanced Analyst

Tableau
Foundation

