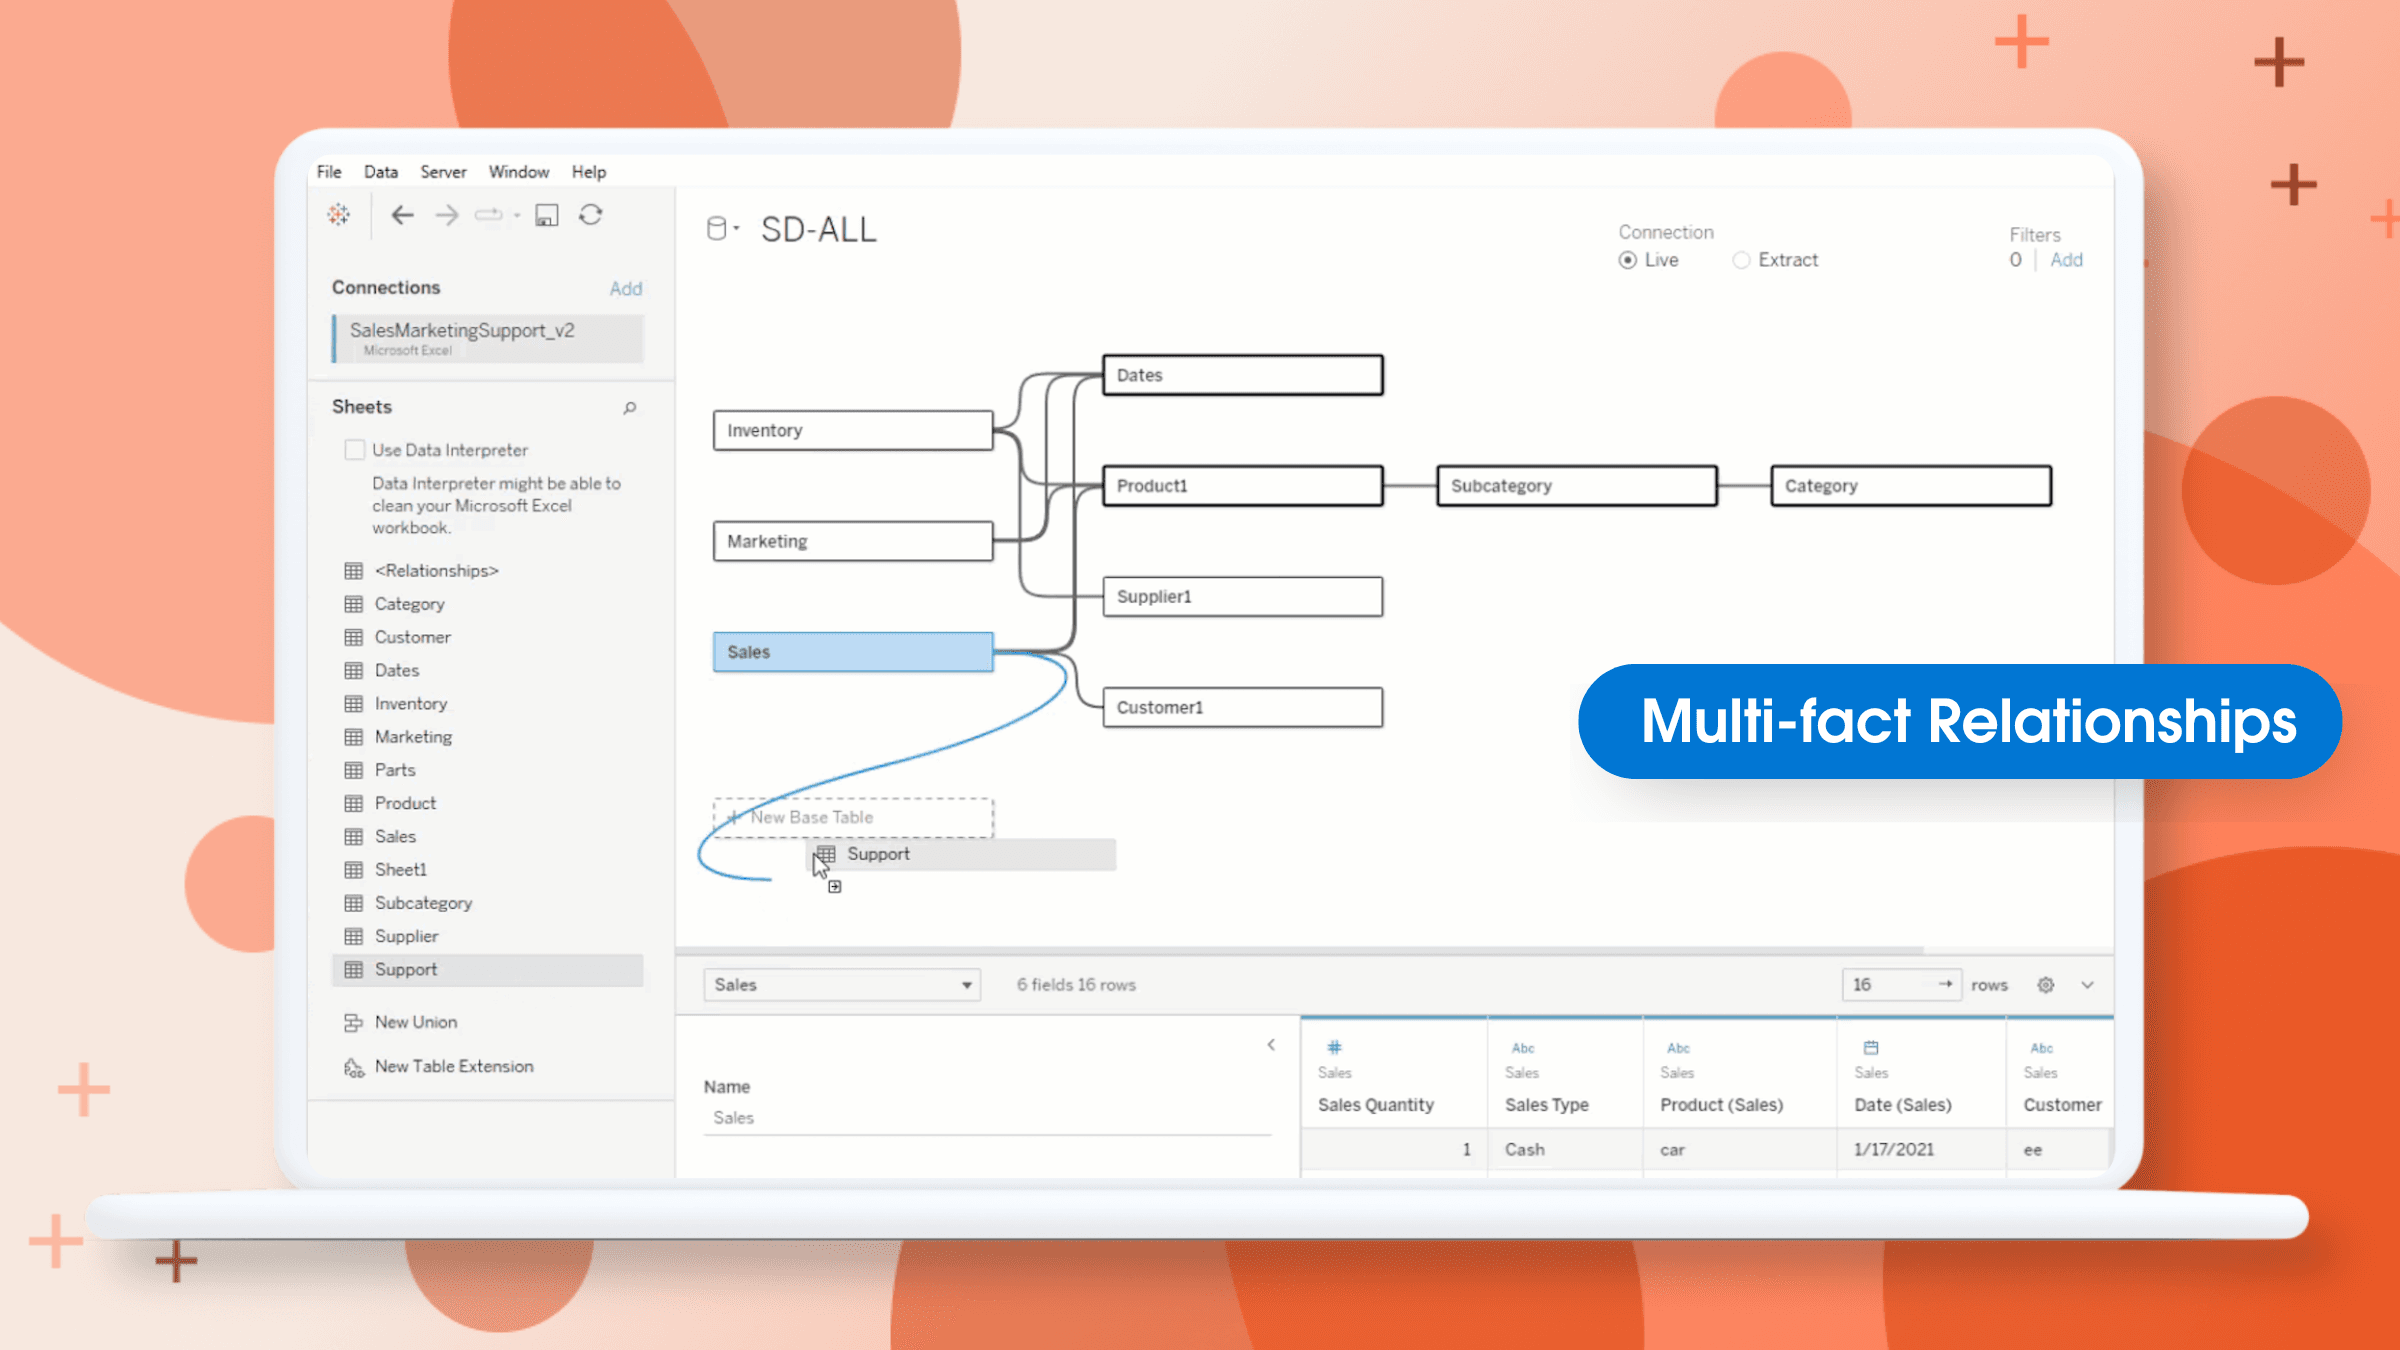
This piece, by Thomas Nahn and Lari McEdward, delves into the intricacies of working with multi-fact relationships, which can significantly enhance your data visualisations by allowing you to analyse multiple measures simultaneously. By understanding how to navigate multi-fact relationships, you can create more sophisticated dashboards that tell compelling stories and deliver deeper insights.
Whether you’re just getting started or looking to refine your advanced skills, you’ll find valuable insights that can improve your data analysis and visualisation efforts – allowing for richer interactions and more informative visual narratives. Don’t miss out on the opportunity to enhance your Tableau expertise – read on today!


