Most dashboard projects start with good intentions – and end with blank stares.
Why? Because they aim to look impressive instead of being genuinely helpful.
But what if we flipped the script? What if your dashboards weren’t just deliverables, but tools that develop insight capability – for you, your team, and your users?
That’s the thinking behind this process:
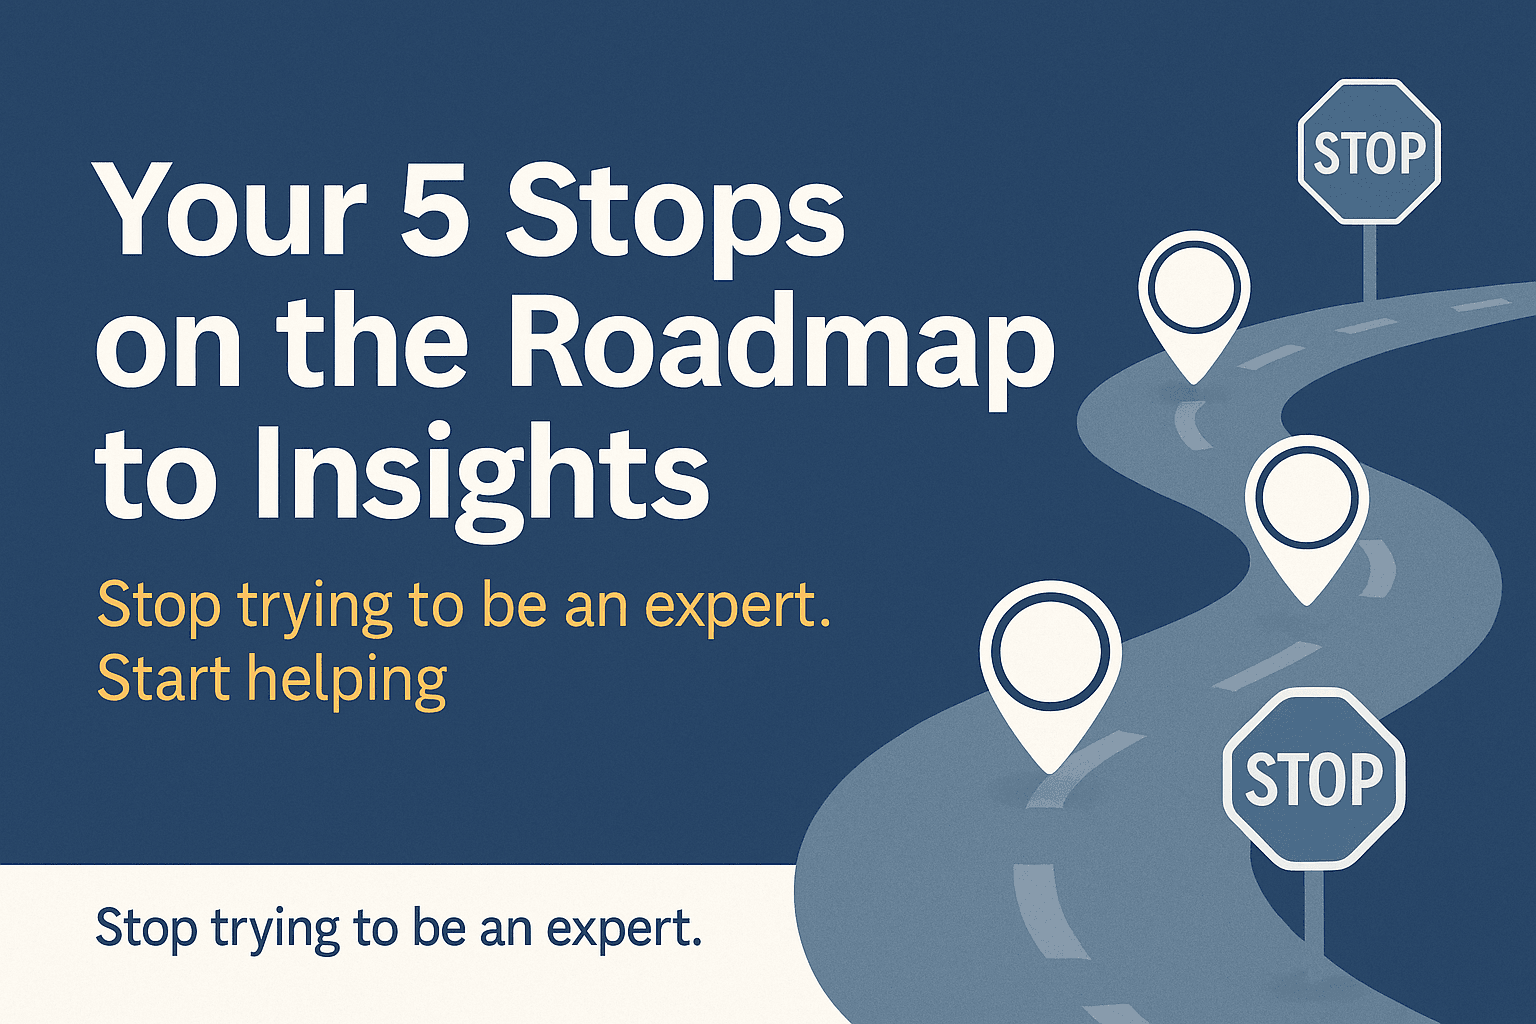
“Your 5 Stops on the Roadmap to Insights”
A practical, people-first approach to building dashboards and growing user confidence – one stop (and one dashboard) at a time.
Why a Roadmap? Why Not Just Build the Dashboard?
Because dashboards aren’t just about data.
They’re about people, decisions, and momentum.
Each “stop” on this roadmap represents a key step in developing insight maturity – starting with basic clarity, and ending with a system that’s trusted, scalable, and self-improving.
This model is aligned with the Powerful Dashboards Framework: a structured, step-by-step approach to building dashboards that drive real decisions – not just visual noise.
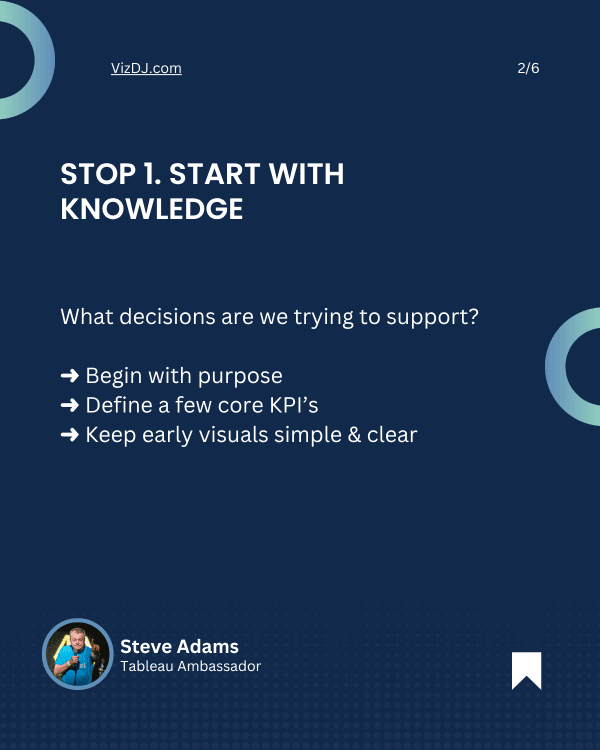
🛑 Stop 1: Knowledge
Start with decisions, not data.
This is where every dashboard (and insight journey) begins.
- Clarify what decisions this dashboard will support
- Introduce a few simple KPIs – ones people can understand and trust
- Use basic visualisations: BANs, bars, simple trends
You’re not trying to impress. You’re trying to inform.
“Data is just the beginning. It’s decisions that matter.”
Brent Dykes, Effective Data Storytelling
This aligns with the Turbocharged Build pillar: start fast, but start focused.
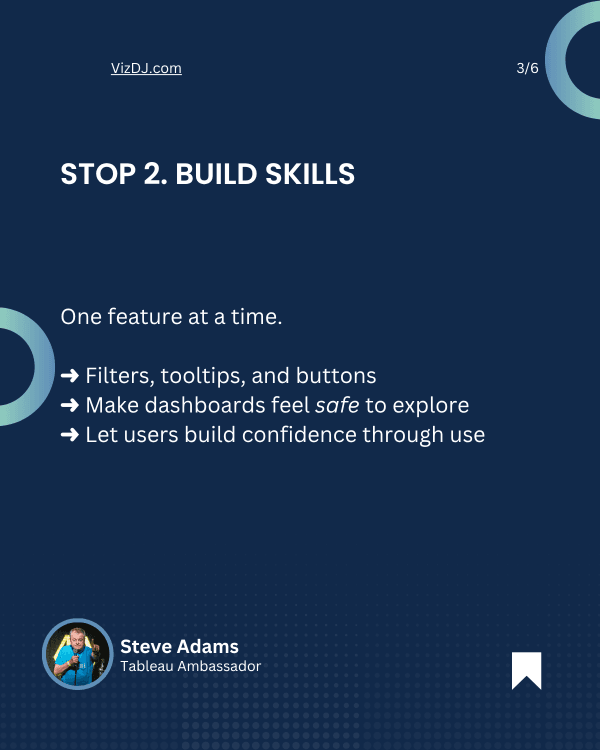
🛑 Stop 2: Skills
Build capability, one interaction at a time.
Once users understand what they’re seeing, it’s time to help them explore.
- Introduce filters, tooltips, or reveal-on-click features
- Teach one new element per release
- Avoid overwhelming users with all the bells and whistles
Each new dashboard becomes a chance to teach something new – gently.
“People resist confusion, not change.”
Donald Miller, StoryBrand
This is pure Fast-Track Learning: keep it small, relevant, and immediately applicable.
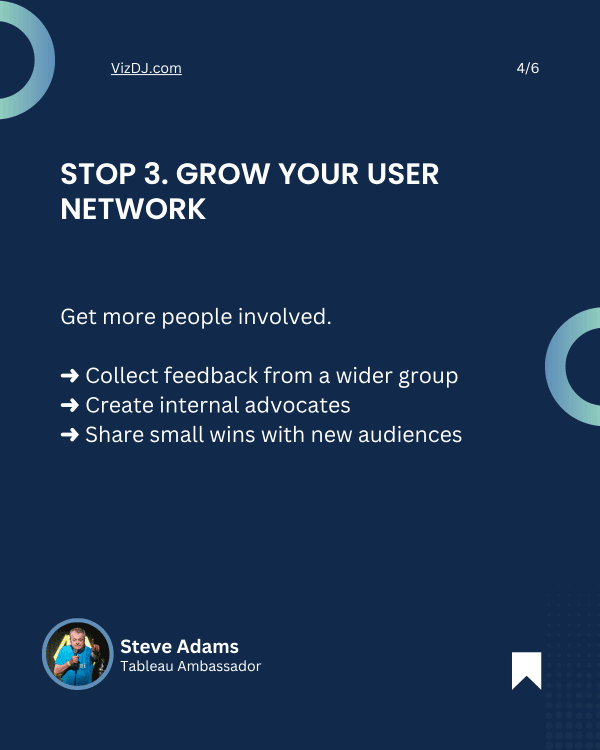
🛑 Stop 3: Network
Create fans, not just feedback.
Don’t just get your sponsor’s approval – build a broader base.
- Ask for feedback from real users, not just senior stakeholders
- Share success stories internally (time saved, faster decisions)
- Let people know their input shaped the final result
You’re creating a data-positive culture – quietly, consistently.
“A dashboard no one uses isn’t a dashboard - it’s a decoration.”
Steve Wexler, The Big Book of Dashboards
This supports Quality Confidence: more eyes, better outcomes.
🛑 Stop 4: Resources
Standardise what works.
Once people are clicking, scrolling, and trusting – bottle it.
- Reuse popular layouts, filters, and colour palettes
- Document common calculations and interactions
- Invest in wider training after you’ve demonstrated value
This is how you turn insights into a system. A scalable one.
“Design systems scale better than heroes.”
NNGroup.com
This is operationalising your dashboard success kit – efficient, repeatable, and trusted.
🛑 Stop 5: Reputation
Let your dashboards do the talking.
Your dashboards are now working. People trust them.
Now it’s time to let the results speak.
- Share outcomes, not features
- Highlight stories of usage and decision-making
- Let users tell others what’s working
You don’t need to prove your expertise – your dashboards already have.
“Trust isn’t built through accuracy. It’s built through usefulness.”
Alberto Cairo, The Functional Art
Bringing It All Together
✅ One dashboard at a time
✅ One decision at a time
✅ One user at a time
This is how insight capability is built:
Not in big bangs, but in small, repeatable steps – each one a stop on the roadmap.
You’re not trying to look smart.
You’re making others feel empowered.
That’s what makes you valuable.
If you’re ready to put this roadmap into practice and grow your insight capability across dashboards, users, and teams – join one of our upcoming courses.
Tableau Training on Tap: Level Up (6 half-days, £1,200) and is perfect for intermediate users who want to push into advanced dashboard design and delivery.
Or join us for Visual Analytics Best Practices (4 half-days, £1,000), where we’ll focus on the layout, logic, and psychology of dashboards that actually get used.
Want both? Even better: join the Tableau Insights Community for £2,000 and get access to both courses plus every other course we run in the next 12 months. You’ll also get coaching, templates, and support that scales with you.
📍 Visual Analytics Best Practices
Let’s make your next dashboard the first step on a whole new roadmap.
This article was featured in Tableau’s Weekly Roundup.


