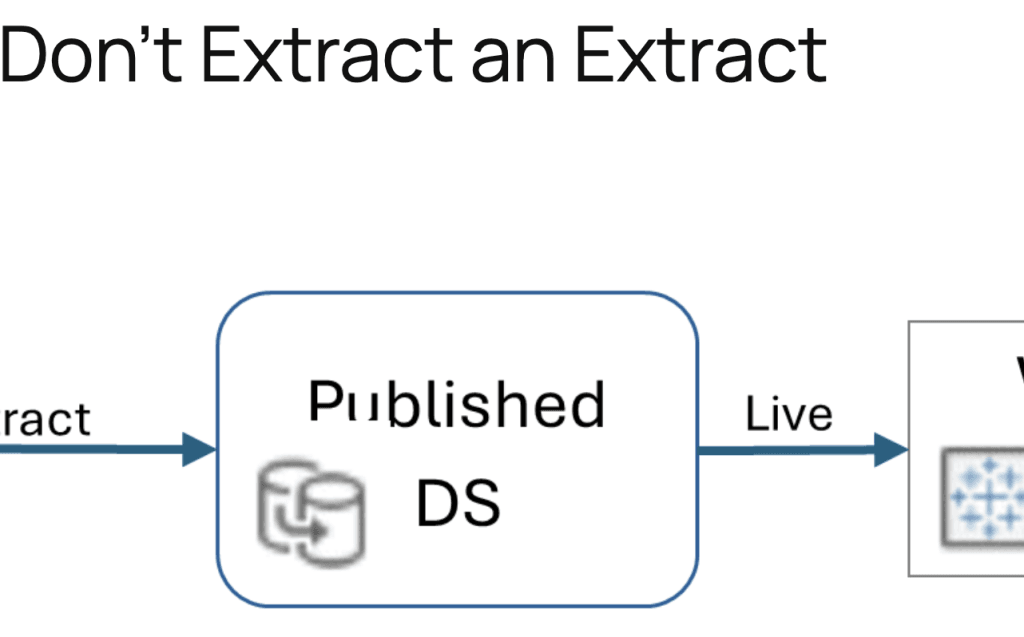
Don’t Extract an Extract
What makes Dan Chissick’s article especially valuable is how clearly it breaks down the configuration mistake and shows what the correct setup should look like so your dashboards always reflect…
What makes Dan Chissick’s article especially valuable is how clearly it breaks down the configuration mistake and shows what the correct setup should look like so your dashboards always reflect…
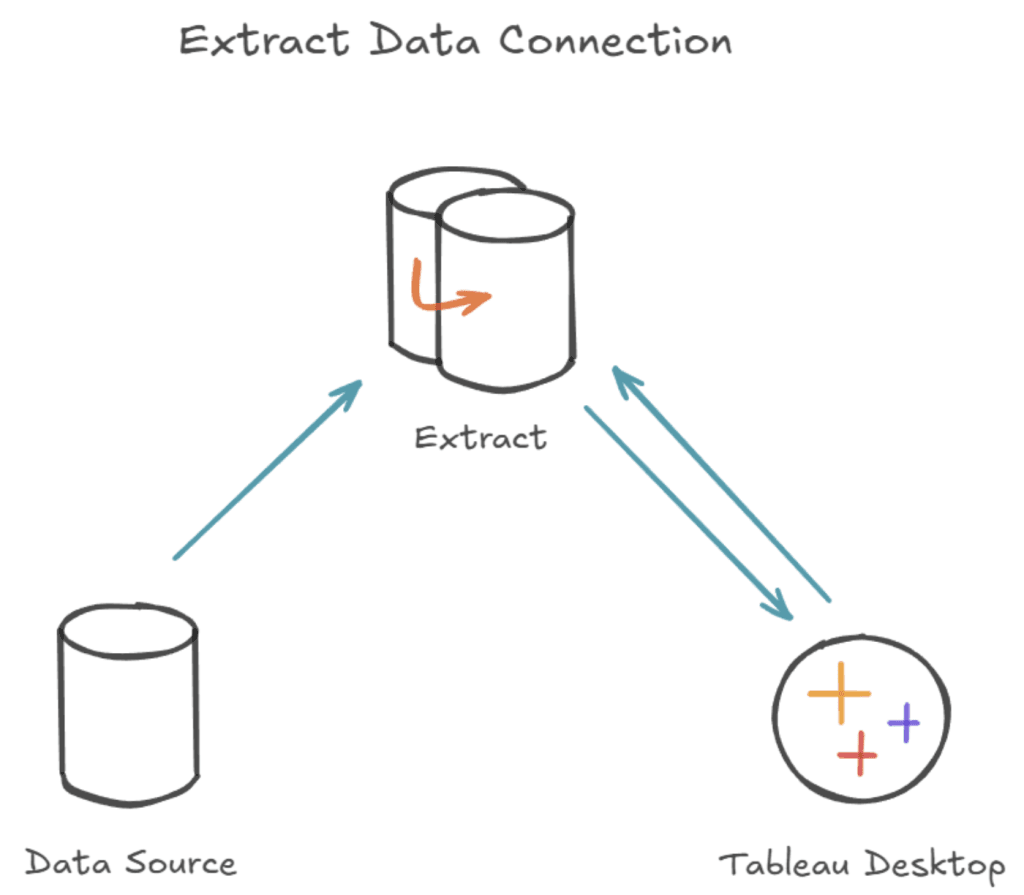
Instead of abstract definitions, you’ll get examples of when Live connections outperform Extracts and vice versa, along with tips to help you avoid common pitfalls. Whether new to Tableau or
What’s the difference between Live and Extract Data Sources? Read More »

Watching this episode with David Lou and Matthew Miller, lets you tap into technical tips, inspiring use cases, and fresh perspectives that you might otherwise miss if you weren’t at
Tableau Roadmap: Innovating Across a Unified Platform Read More »
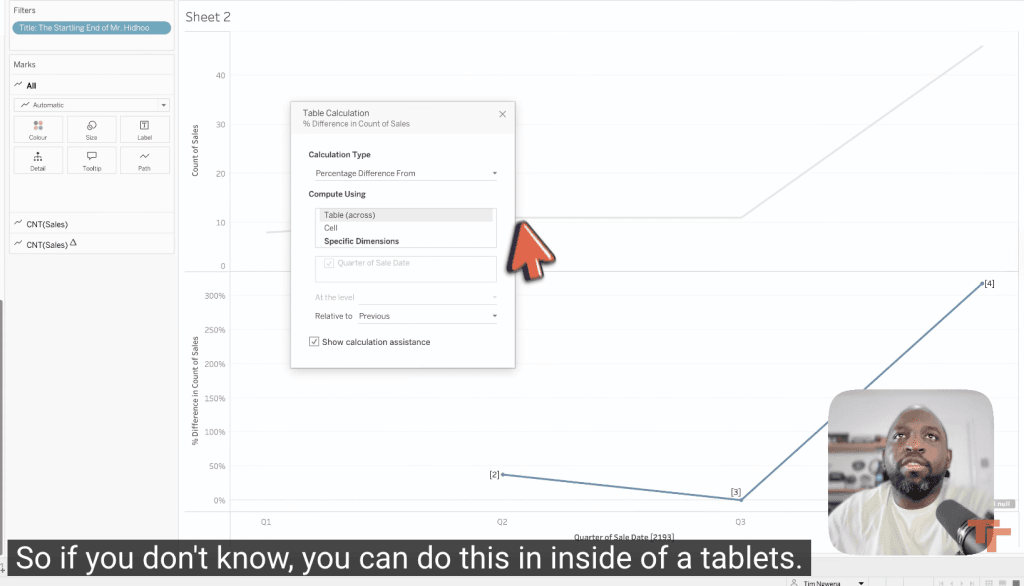
Tim Ngwena’s video offers practical insights and real examples that you won’t find in typical tutorials. You’ll see how AI’s interpretations can be both surprising and powerful, but also why
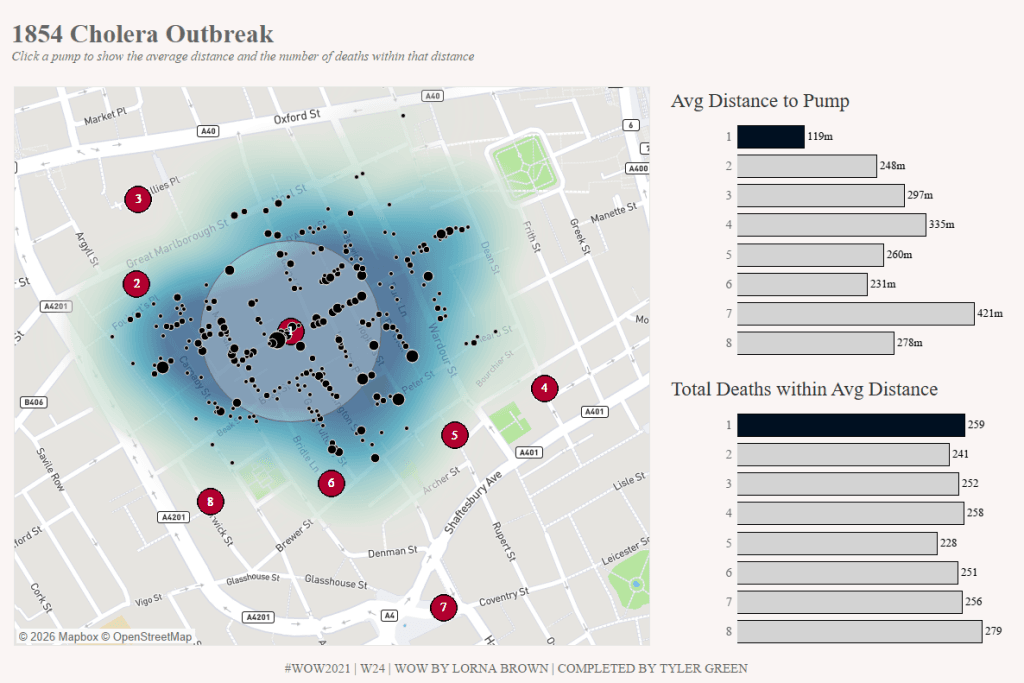
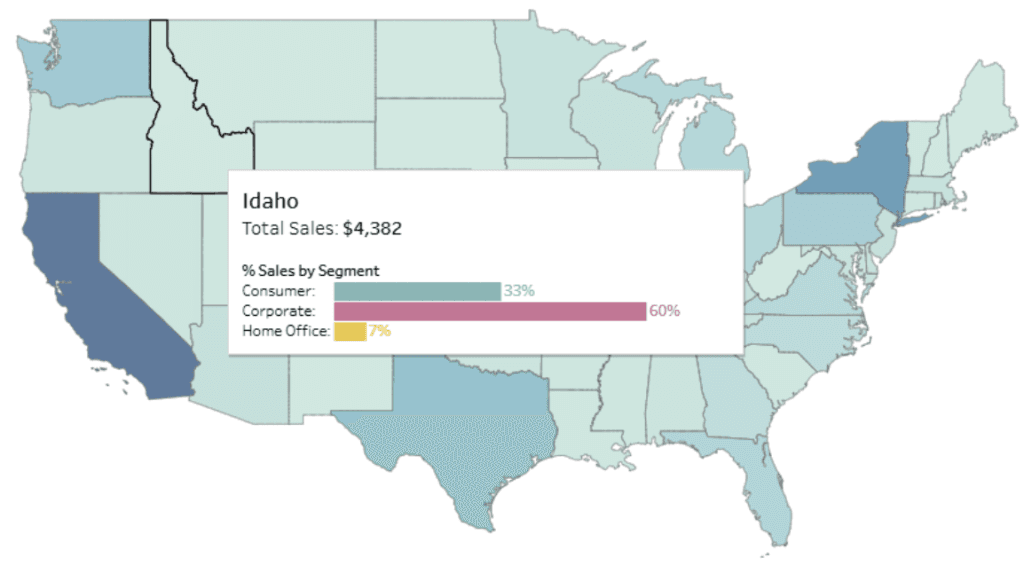
Tyler Green blends practical guidance with visual examples – demonstrating not just what to do but why certain approaches work better in spatial analytics. If you’ve ever felt unsure about
Mastering Maps: A Guide to Spatial Analysis in Tableau Read More »
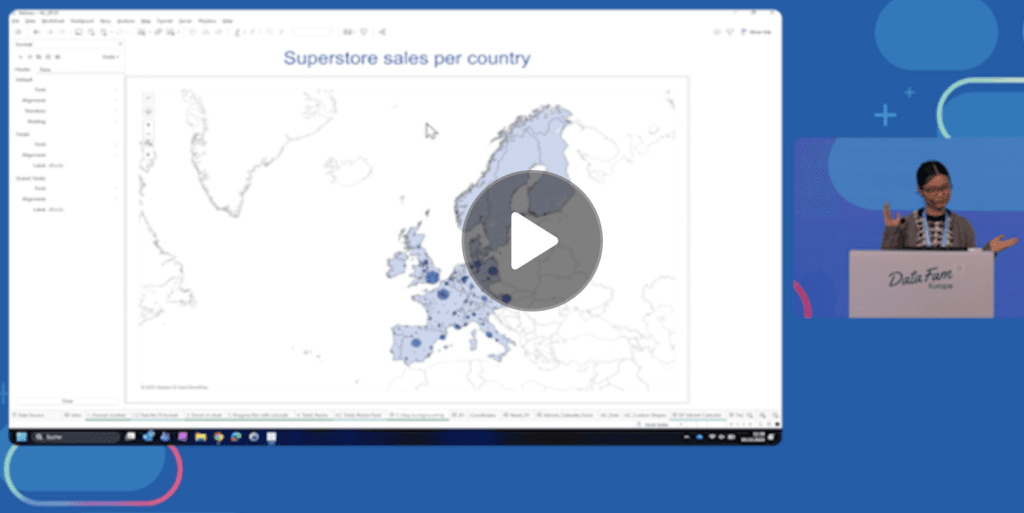
What makes this episode valuable, is that it comes from DataFam Europe 2025 – a gathering of Tableau enthusiasts, community leaders, and product experts. It’s like having a mini conference

Whether you’re curious about new capabilities, integrations, or the broader vision behind Tableau’s development, this live discussion with Nathan Settembrini and Chris Williams captures key highlights and expert commentary that
What’s NEXT for Tableau? Data Secrets LIVE from Dreamforce 2025 Read More »
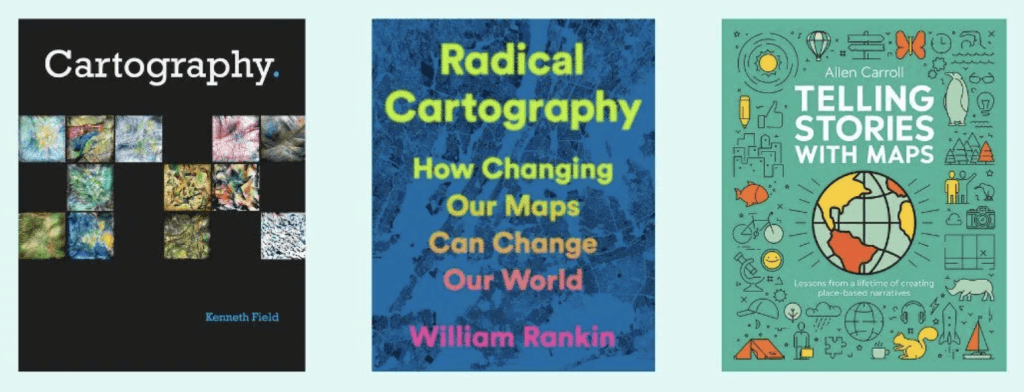
Whether you’re creating your first geospatial dashboard or already blending maps into complex narratives, you’ll gain insights that go beyond the typical “how-to” books. It’s the ideal reading guide if
Donna Coles breaks down the idea step by step – showing both the logic and the practical implementation, so you can see exactly how the trick works and adapt it
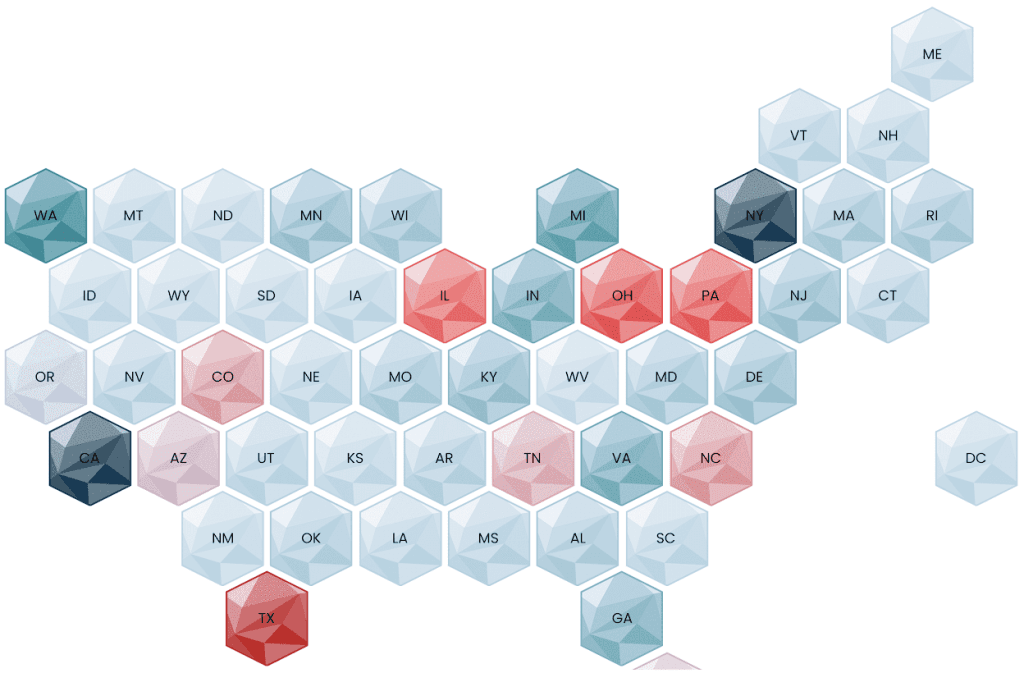
Here, with Ken Flerlage, you’ll find explanations of when hex maps work best, how to create them in tools like Tableau, and examples that show how they improve storytelling without
