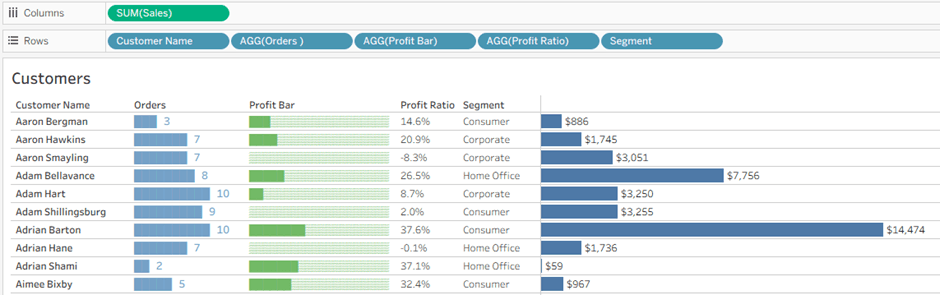
Where is Data Visualization Innovation?
This piece with Jonathan Schwabish raises critical questions: Are we still innovating, or are we refining past breakthroughs? It challenges readers to look beyond flashy visuals toward deeper shifts –…
Lindsay Betzendahl walks us through with clear, step-by-step instructions, demonstrating how you can put these tricks into action. Whether you want to aid user navigation, draw attention to a particular
What’s great about this article is its real-world relevance. Whether you’ve inherited someone else’s workbook or are juggling multiple Tableau projects, these tools help you document faster and more accurately
Tired of Documenting Tableau Dashboards? These 4 Tools Make It Easier Read More »
What sets this series apart is its approachable format – think digestible trail‑guide style tips that are easy to bookmark and revisit. Blake Feiza mixes time‑saving shortcuts (like maximising mark
Troy Schuh’s piece goes deep into the different types of agents empowering this shift – goal‑based, utility‑based, and the emerging learning agents that adapt over time. Along the way, you’ll
Agentic AI and Tableau Next: A Look Inside the Future of Analytics Read More »
Learn how to adjust label colours, sizes, and positioning for each segment in a stacked bar, enhancing readability and visual clarity – particularly in presentations or dashboards where detail matters.
Stacked Bar Chart With Multiple Label Colors in Tableau Read More »
Mariia Sapsai’s instructions are straightforward and accessible, making it easy to replicate – even if you’re newer to Tableau or less familiar with date-based layouts. Beyond the core build, she
Funnel charts are a powerful tool for depicting step-by-step drop-off within a process. Whether you’re analysing sales conversions, onboarding flows, or customer journeys, a funnel view helps make complex behaviour
Area Funnel chart in Tableau: Visualizing the Drop-Off Read More »
How to prevent your dashboard from quietly sabotaging decisions Imagine this. You’ve designed a beautiful dashboard. The metrics are accurate. The filters work. The layout looks clean. But then
With Fee Gordon and Sarah Bernett, Kathryn McCrindle discusses her philosophy of treating every project as a “win or learn” opportunity – a mindset that champions experimentation, resilience, and continuous
Tableau Iron Viz Journey: Win or Learn, You Can’t Lose with Kathryn McCrindle Read More »