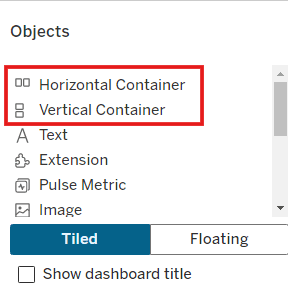
Use the SIGN() function
Serena Purslow provides a practical use case – tracking the change between two measures and shows how to visually represent this with colour-coded indicators or icons based on the sign…
Johan de Groot provides a walkthrough on setting up your first Table Extension, including using Python to pull live data without storing anything. He also explores the benefits and best
API to Tableau, the Smart Way: A Guide to Table Extensions Read More »
Dawn Harrington (TechTipsGirl) shares her learning journey – referencing tutorials and dashboards that inspired her creations. By exploring these examples, you’ll gain a deeper understanding of how Measure Names and
What Charts Can You Create With Measure Names / Measure Values? Read More »
What sets Ollie Linley’s tutorial apart is its practical approach to enhancing dashboard interactivity and readability. He delves into techniques like adding directional arrows to summary tiles, providing month-over-month comparisons,
Dawn Harrington’s post is comprehensive – detailing the creation of essential parameters and calculations. By following her instructions, you’ll learn how to build a burndown chart that not only tracks
Deepak Holla makes complex concepts accessible even to those new to Tableau. Learn how to set up dynamic parameters and sorting mechanisms that empower end-users to explore data from multiple
Drag and drop files into Tableau for a quick connection || Tableau “Quick Tip” Series Read More »
Even if you don’t regularly build sales funnels, with this YouTube tutorial by Eric Parker, you’ll gain valuable insights into Tableau’s capabilities and best practices for dashboard design. Eric’s experience
Andy Kriebel’s YouTube video offers a walkthrough on structuring your data, creating necessary calculations, and building the Jump Plot in Tableau. Learn how to compute metrics like customer tenure and
How to Analyze Customer Retention with a Jump Plot Read More »
They tell you ‘what’. It’s your job to find out ‘why’. The Brief Isn’t the whole Truth and Nothing But the Truth… When a stakeholder says, “Can I have a
Serena Purslow covers various scenarios where custom labels can make a significant impact – such as emphasising growth percentages or denoting specific categories with unique formatting. Her step-by-step approach makes