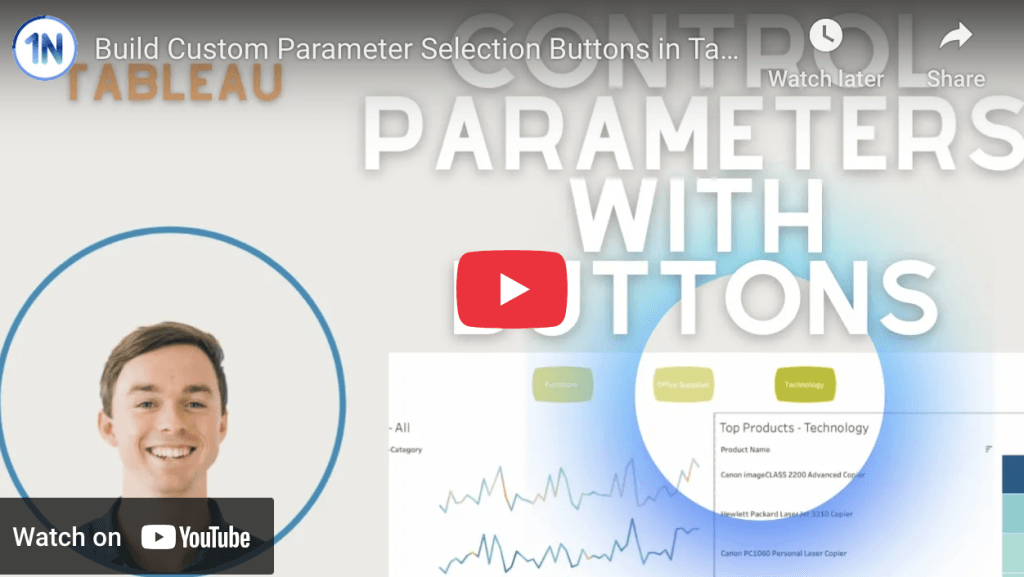
How to Replace a Datasource & Fields in Tableau
In this video post, Andy Kriebel provides clear, actionable steps to seamlessly replace outdated data sources with updated ones. This technique can be a huge time-saver, especially if you frequently…
A must-read post by Takhmina Pirmahmadova (at the Data School), delving into the power of parameters in Tableau – showing how you can transform static visuals into interactive tools that
Transforming Visualizations with Parameters in Tableau Read More »
Here, Ann Pregler addresses a common challenge in Tableau: how to reset filters cleanly without causing distracting highlights that can confuse users. Ann breaks down a simple, effective solution that
Level Up: ‘Reset Filters’ Button (With No Highlighting!) Read More »
Renaming fields and creating aliases may seem like small tweaks, but they can significantly enhance the readability of your dashboards. Jennifer Dawes guide walks you through how to rename fields
Tableau Tiny Tip Tuesday – Renaming Fields and Aliases Read More »
As data professionals, we’ve all heard it: “Don’t use red and green in dashboards – people with colour vision deficiency won’t be able to tell the difference.”Fair. But incomplete. The
Don’t Lose Your RAG: Using Red, Amber & Green the Right Way Read More »
Let’s face it – there’s a reason dashboards still get exported to Excel. It’s not because users love spreadsheets. It’s because they’re not yet confident navigating your dashboard. They don’t trust what
Table calculations in Tableau – the pièce de résistance that lets you tweak your data display without mucking about with the raw numbers. They come into play right after all
Ever applied a filter in Tableau only to find your calculation ignores it? That’s because Level of Detail (LOD) expressions play by their own rules in Tableau’s Order of Operations.In this post, we’ll break
Cracking the Code: Level of Detail (LOD) Expressions vs. Filters Read More »
Filters in Tableau work in layers, starting from Extract Filters (which limit data before Tableau even loads it) all the way down to Table Calculation Filters (which only affect the display). Here is the standard
WHO’s symbology system ensures that symbols and icons are easy to interpret, even in different cultural and linguistic contexts. This is crucial for public health communication and so particularly valuable