Burndown Budget Calculator
Dawn Harrington’s post is comprehensive – detailing the creation of essential parameters and calculations. By following her instructions, you’ll learn how to build a burndown chart that not only tracks…
Dawn Harrington’s post is comprehensive – detailing the creation of essential parameters and calculations. By following her instructions, you’ll learn how to build a burndown chart that not only tracks…
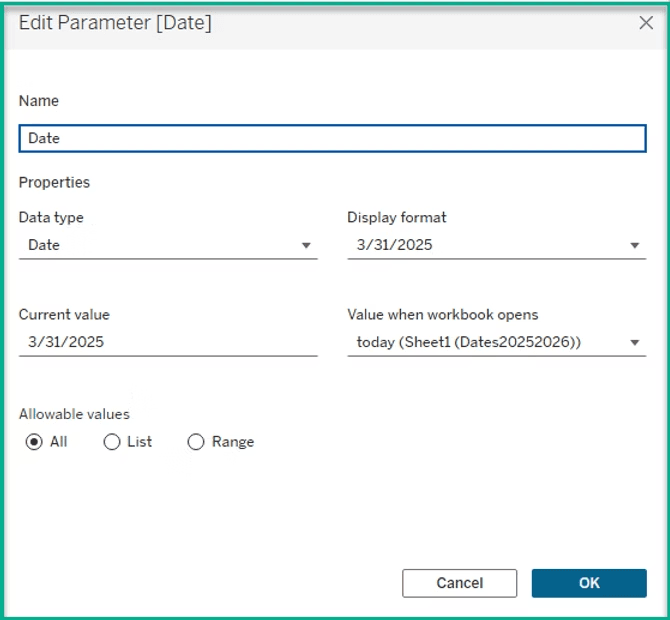
Deepak Holla makes complex concepts accessible even to those new to Tableau. Learn how to set up dynamic parameters and sorting mechanisms that empower end-users to explore data from multiple
Drag and drop files into Tableau for a quick connection || Tableau “Quick Tip” Series Read More »
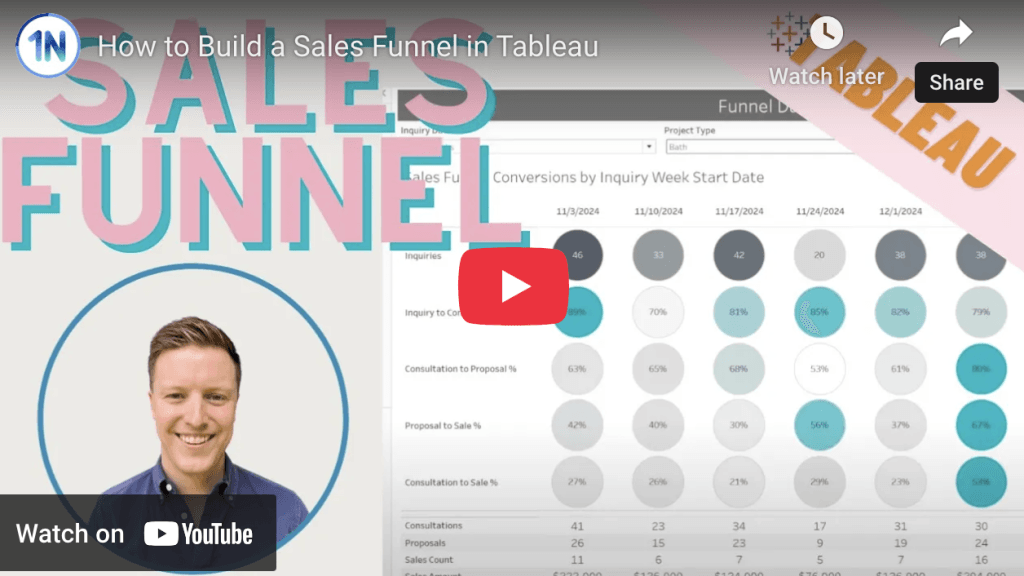
Even if you don’t regularly build sales funnels, with this YouTube tutorial by Eric Parker, you’ll gain valuable insights into Tableau’s capabilities and best practices for dashboard design. Eric’s experience
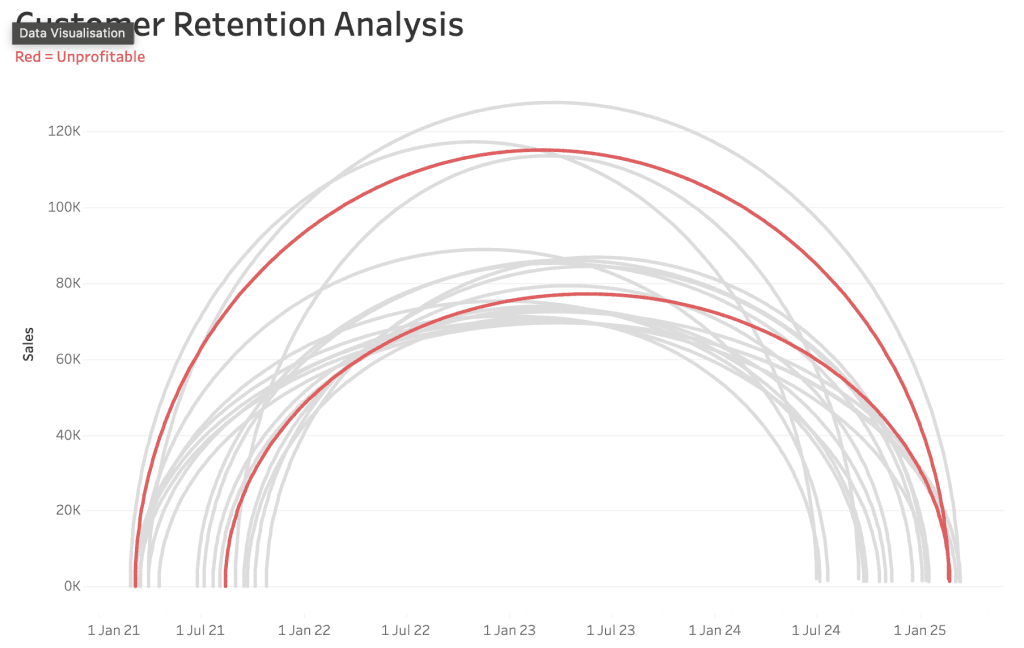
Andy Kriebel’s YouTube video offers a walkthrough on structuring your data, creating necessary calculations, and building the Jump Plot in Tableau. Learn how to compute metrics like customer tenure and
How to Analyze Customer Retention with a Jump Plot Read More »
They tell you ‘what’. It’s your job to find out ‘why’. The Brief Isn’t the whole Truth and Nothing But the Truth… When a stakeholder says, “Can I have a
Serena Purslow covers various scenarios where custom labels can make a significant impact – such as emphasising growth percentages or denoting specific categories with unique formatting. Her step-by-step approach makes
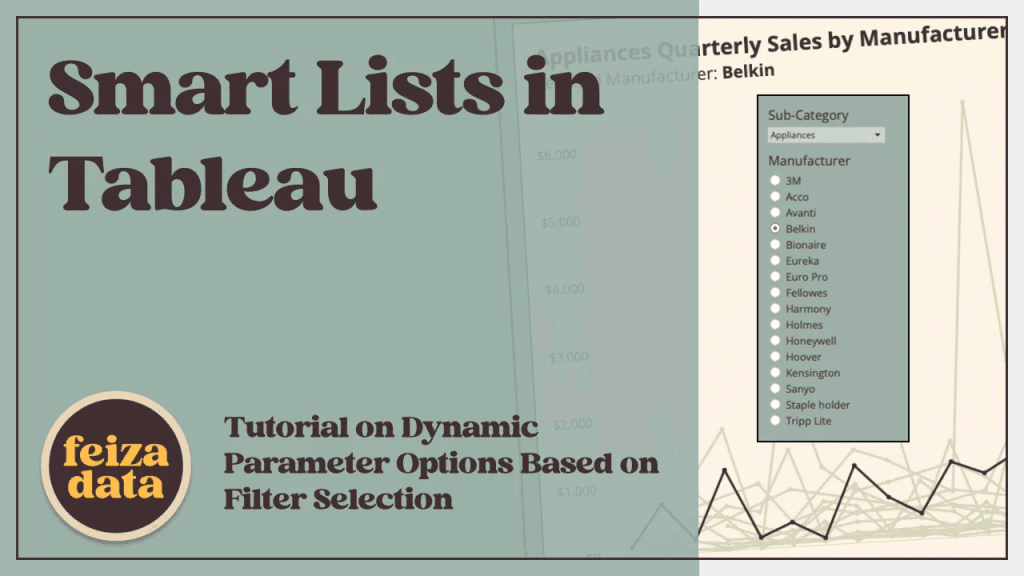
Blake Feiza’s tutorial walks you through creating a sub-category parameter, a supporting calculated field, and a Level of Detail (LOD) calculation to identify relevant manufacturers. By leveraging sets and context
Smart Lists in Tableau: Dynamic Parameter Options Based on Filter Selection Read More »
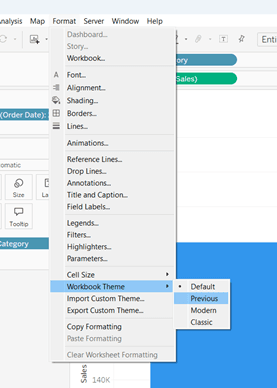
Caroline Swiger, featured on Sarah Pallett blog page, walks through how to export a custom theme from a formatted worksheet and import it into a new workbook – effectively replicating
Save Time with Custom Themes! Guest Blog Post by Caroline Swiger Read More »
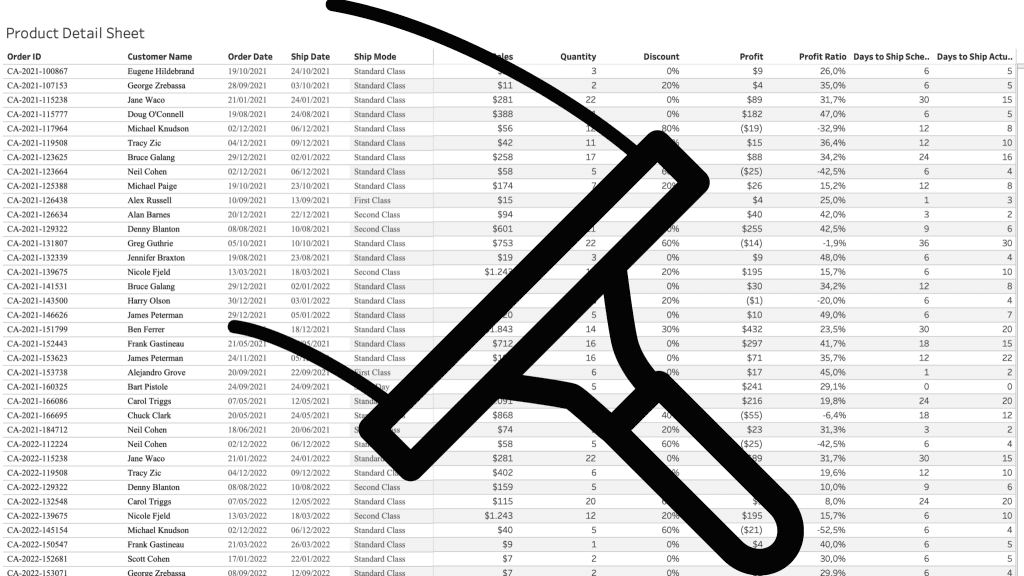
Johan de Groot’s tutorial introduces advanced formatting strategies – including converting standard tables into more flexible structures using dummy measures. This allows for greater customisation – enabling you to combine
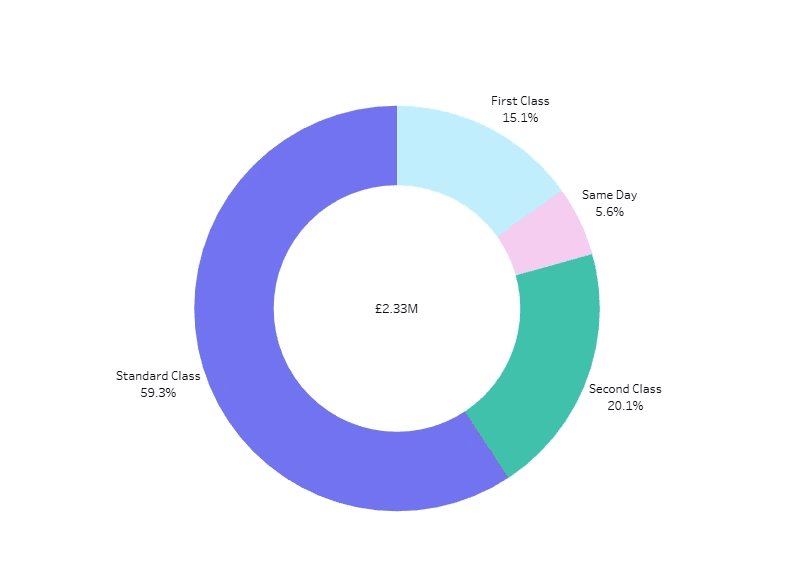
Ollie Linley (at OneNumber) provides step-by-step instructions to build a donut chart by calculating the percentage of total for your measure and its remainder, then layering a smaller circle on
