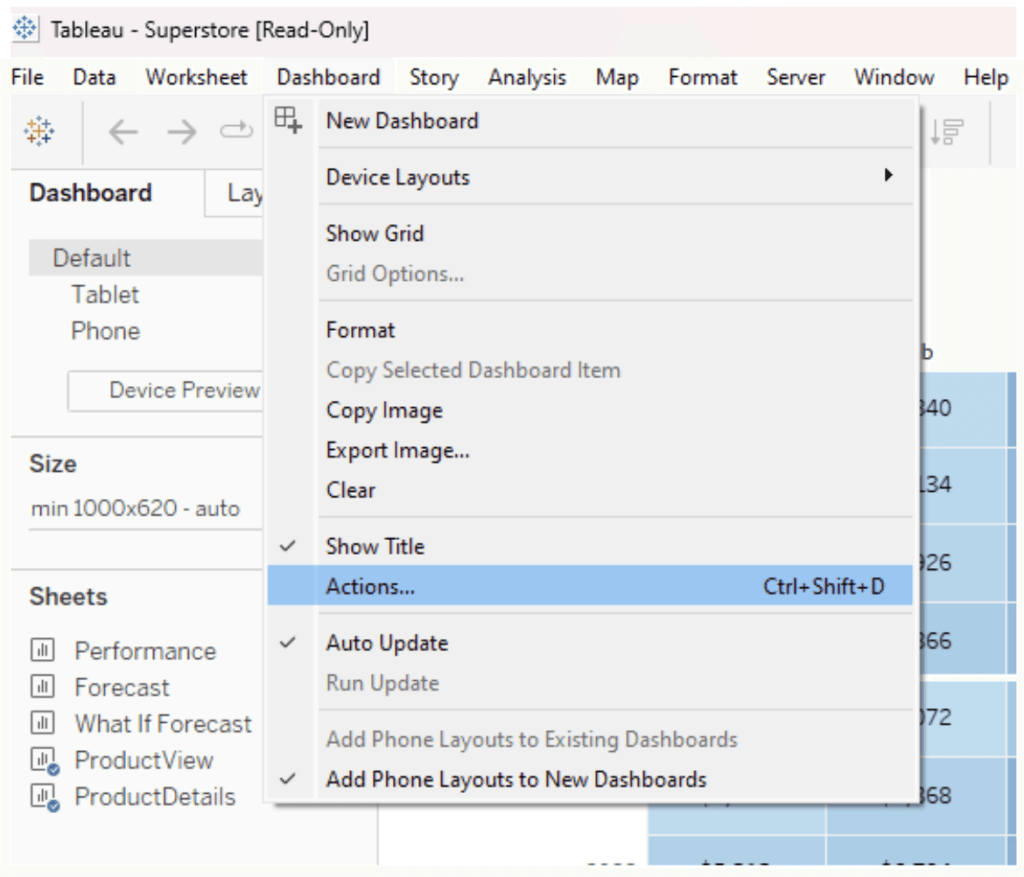
Actions in Tableau vs. Power BI
If you’re debating whether Tableau or Power BI is the better tool for your interactive data visualisations, check out this post, by Kirsty Wall, as she dives deep into how…
If you’re debating whether Tableau or Power BI is the better tool for your interactive data visualisations, check out this post, by Kirsty Wall, as she dives deep into how…
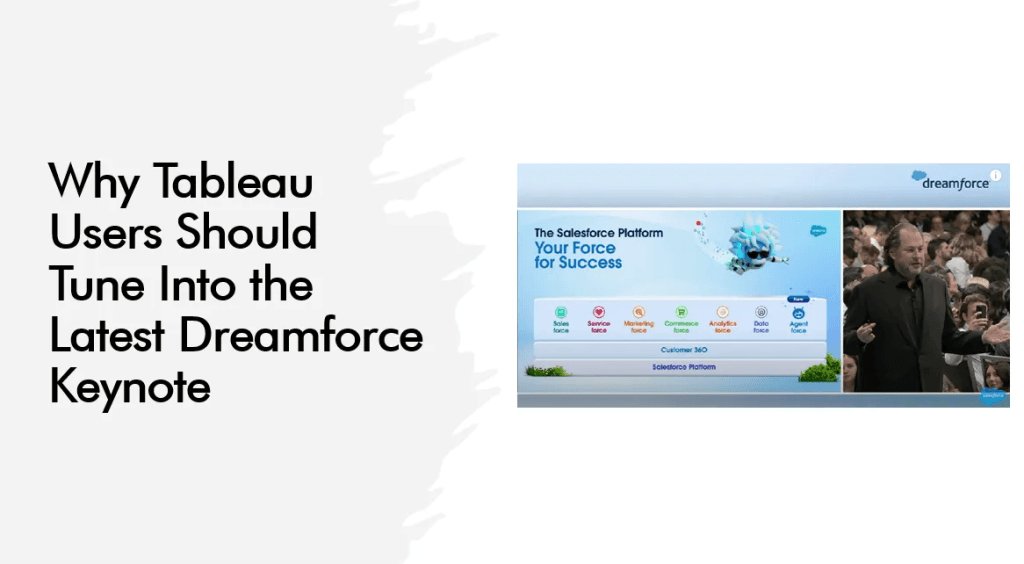
If you’re a Tableau user, it’s crucial to stay ahead of the latest innovations, and the recent Dreamforce keynote offers valuable insights into the future of data analytics. Adam Mico’s
Why Tableau Users Should Tune Into the Latest Dreamforce Keynote Read More »
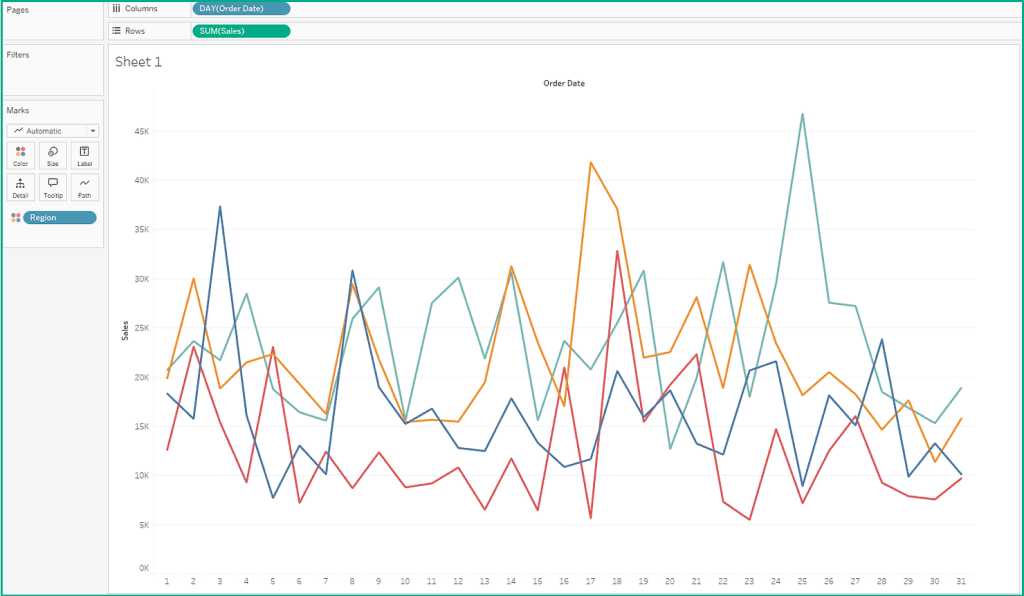
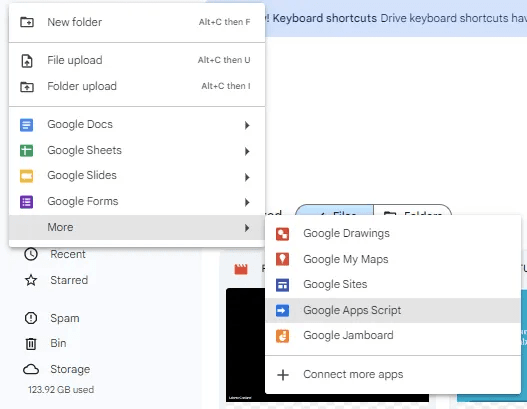
If you’re aiming to add more flexibility to your Tableau dashboards, Dawn Harrington walks you through creating a date filter that allows users to switch between different time levels –
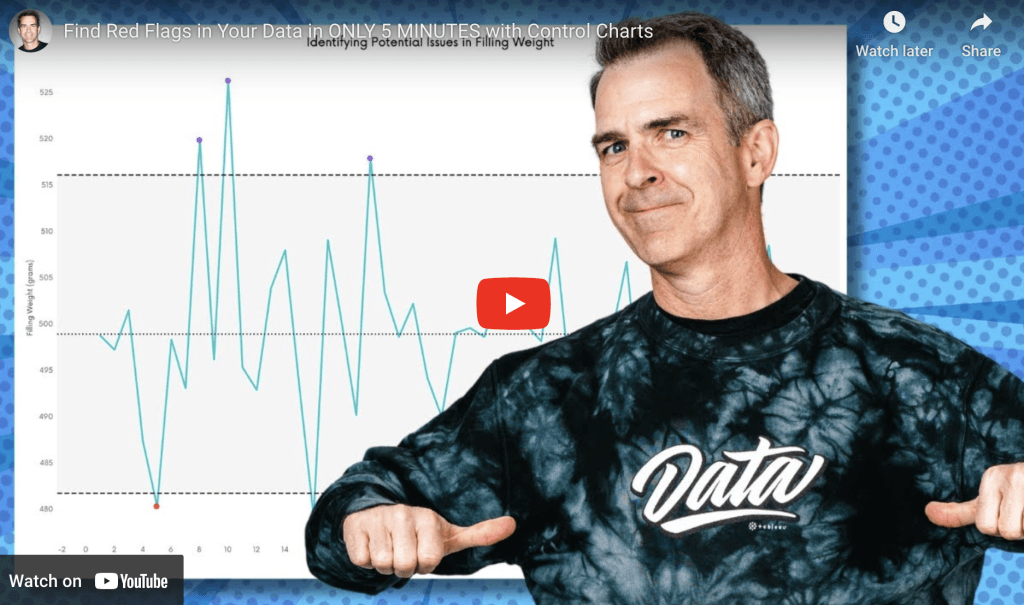
If you’re looking to enhance your data analysis skills, this post by Andy Kriebel is a must-read. It provides a quick, step-by-step guide on how to create control charts in
Find Red Flags in Your Data in ONLY 5 MINUTES with Control Charts Read More »

Effective dashboard design isn’t just about aesthetics; it’s about providing actionable insights that transform data into decision-making power. In this article, we delve into our Proven Process for building powerful
Unlocking The Secrets Of Effective Dashboard Building: Your Proven Process Read More »
If you’re interested in data visualisation and environmental insights, Sam Grasland‘s article is an excellent resource that you won’t want to miss. His comprehensive guide walks you through the process
Feeding Daily Air Quality Data from an API to Tableau Pulse Read More »

Ken Flerlage’s post (featuring Kasia Gasiewska-Holc dives into best practices for implementing dual-view charts, emphasising the importance of context and design. It offers valuable tips on ensuring that your visualisations
This valuable article with Andy Kriebel, breaks down the steps to effectively calculate year-over-year changes, highlighting essential techniques such as Level of Detail (LOD) expressions. With clear explanations and practical
How to Calculate Year over Year Change in Tableau Read More »
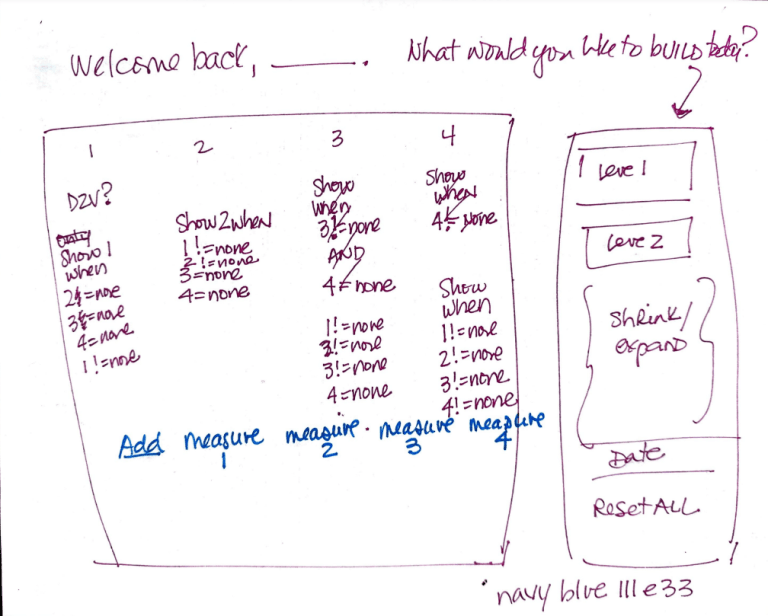
Sarah Pallett‘s blog post takes us through the entire process of designing a customisable crosstab dashboard – from initial sketches to the final build. She highlights how to implement key
Build Your Own Crosstab: from concept to final build Read More »

If you’re working with Tableau and need to better understand ranking functions, Robby White’s post at Interworks is a fantastic resource. He explores how the Rank Dense function can help
