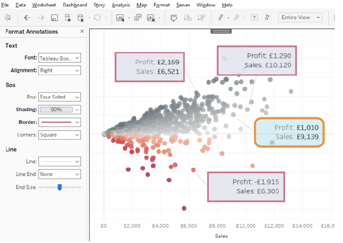
Dashboard Productivity Tips
Here, Marc Reid shares some tips he’s found useful to speed things up when creating dashboards. Read Original Article…
Here, Marc Reid shares some tips he’s found useful to speed things up when creating dashboards. Read Original Article…
A great post by Jason Penrod …”The Button. Seemingly simple – yet so powerful. As humans, we are well versed in buttons and have been trained to use buttons from
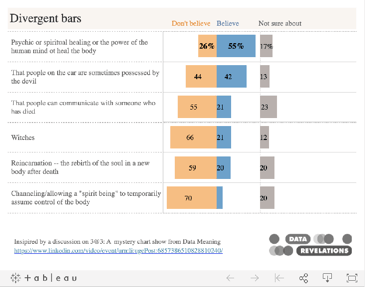
Decluttering by making the first row different from the other rows Read Original Article…
Decluttering by making the first row different from the other rows Read More »
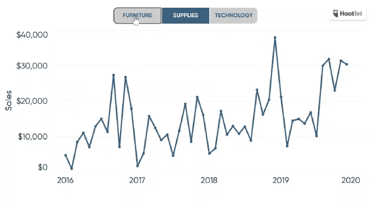
“I have come up with 3 innovative ways to incorporate zoom functionality in Tableau” An informative post by Ethan Lang, including some bonus formatting tips… Read Original Article…
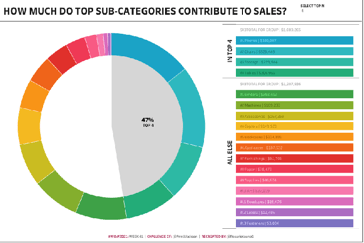
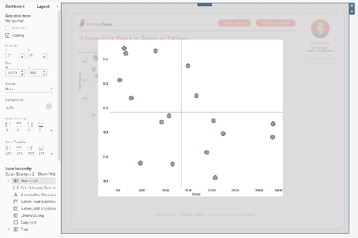
Here, Rosario Gauna shows us the challenges of the last two weeks of #WOW which involved building a pie/donut chart to represent the Top N sales percentage. Read Original Article…

Ken Flerlage guides us through his 4 tips, using examples from his Coxcomb Chart Template… Read Original Article…
4 Tips for Writing Complicated Tableau Calculations Read More »
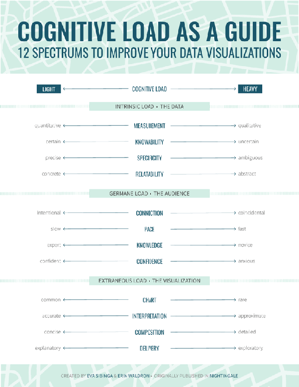
Post by Eva Sabinga and Erin Waldron “With cognitive load as our guide, we use twelve unique spectrums to gauge the complexity of our data on one side, identify the
Cognitive Load as a Guide: 12 Spectrums to Improve Your Data Visualizations Read More »
Here’s a great post by Kevin Flerlage: “At work a few weeks ago, my colleague, Ethan Hahn, and I were presented with a problem…” Read Original Article…
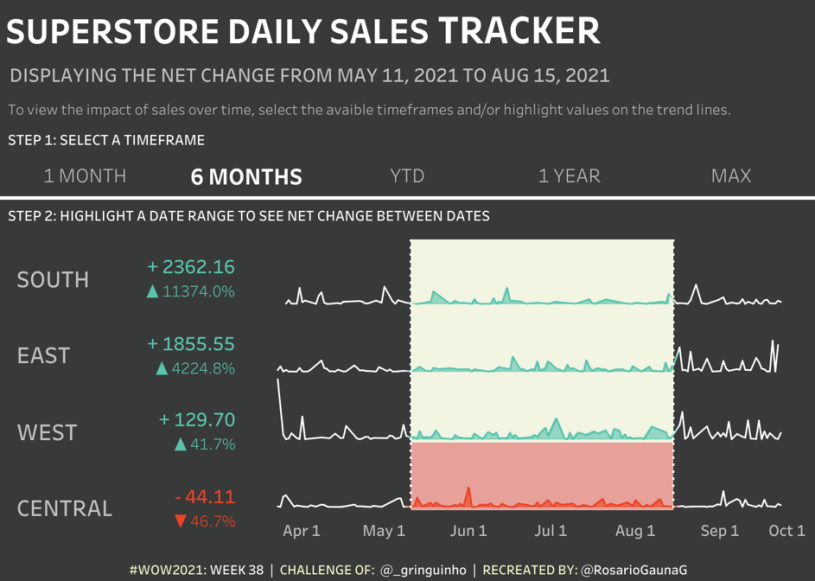
In this post, Rosario Gauna, shares the final steps to her solution of a challenge posed by Will Perkins… Read Original Article…

A great post by Andy Cotgreave, all about CEO Cockpits… “If we wanted to design an efficient overview of an entire organisation, where would we go for inspiration?” Read Original
So you want a CEO cockpit for your data? Here’s some inspiration Read More »
