PIE/DONUT CHART & THE TOP

Want to Get Latest Updates and Tips on Tableau Bites Blogs

Picturepie

Here, Rosario Gauna shows us the challenges of the last two weeks of #WOW which involved building a pie/donut chart to represent the Top N sales percentage.
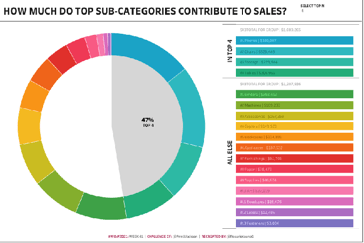
Read Original Article…

Share This Post:

001 database

Tableau Training on
Tap Fast Track

data scientist 1

Tableau Advanced Analyst

002 bar chart

Tableau
Foundation

003 network

Tableau Training
on Tap

Share :

Leave a Comment

Your email address will not be published. Required fields are marked *