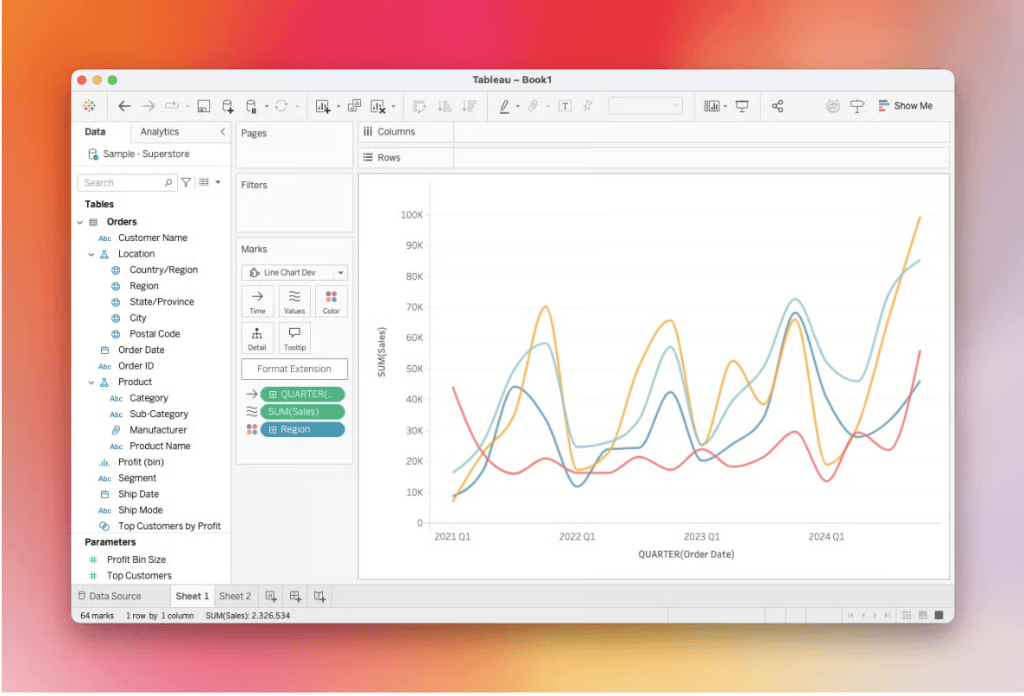
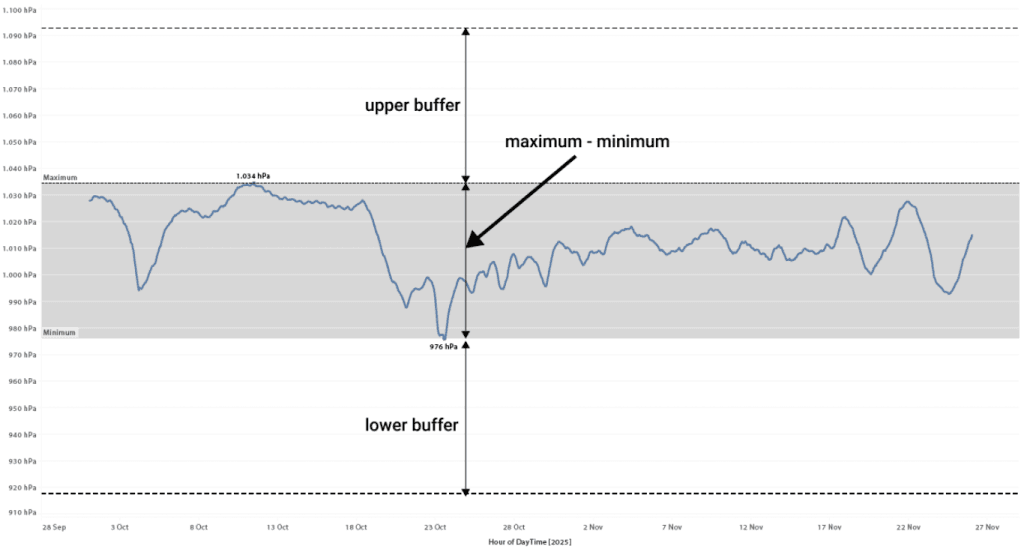
How I Design an Actuals vs Target Chart
Elevate your data visualisation skills – especially in presenting “Actuals vs. Target” comparisons, with this blog post from Kevin Flerlage. He breaks down the process of designing these charts in…
Nico Gerbrecht’s post provides an in-depth look at the diverse ways you can utilise published data sources to enhance your data analysis and visualisation efforts. His article breaks down practical
What Can We Do with Published Data Sources in Tableau? Read More »
If you’re looking to understand why SQL education is essential for both personal and organisational success, Dawn Harrington’s post is a must-read. It delves into the hidden costs of neglecting
The Cost of NOT Educating Your Employees Or Yourself (On SQL) Read More »
If you’re looking to bring a fresh, modern twist to your Tableau visualisations, check out this post, by Andy Kriebel. Traditional bar charts are effective, but this guide shows you
Here’s a post by Omokehinde AyodejiI tackling a common issue – those distracting white boxes around your legends – and shows you how to eliminate them for a cleaner, more
This post, by Amy Esselman addresses the critical question of whether your point is clear when you’re presenting data. It offers actionable insights into how to design visualisations that not
If you’re concerned about how artificial intelligence might transform – or even threaten – the role of data analysts, continue reading this post by Will Sutton. An insightful article tackling
If you want to make your Tableau visualisations more dynamic and impactful, this post, by Lindsay Betzendahl is a great place to start. She walks you through how to colour
Tableau is a powerful visualisation tool. However, it doesn’t offer the capability to create tables. Google Sheets can bridge the gap and even go further by combining data collection, translation,
This post, by Andy Kriebel, breaks down how to go beyond the standard date groupings in Tableau, allowing you to tailor drill-down paths, such as Year-to-Quarter or Year-to-Month, giving you
How to Create Custom Date Hierarchies in Tableau Read More »