AN INTRO TO BASIC STRING CALCULATIONS: LEFT, MID AND RIGHT FUNCTIONS
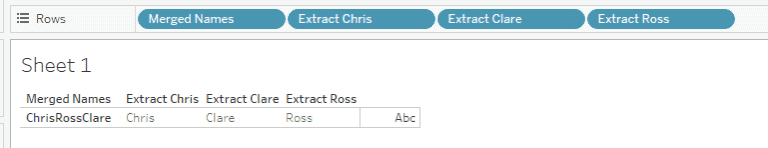
Ross Easton from The Information Lab’s Data School gives you a basic introduction into string calculations in Tableau. Ross focuses on the left, mid and right functions of string calculations,…
AN INTRO TO BASIC STRING CALCULATIONS: LEFT, MID AND RIGHT FUNCTIONS Read More »