The Tableau VizQL Data Service: What It Is, What It Can Do, and When to Use It
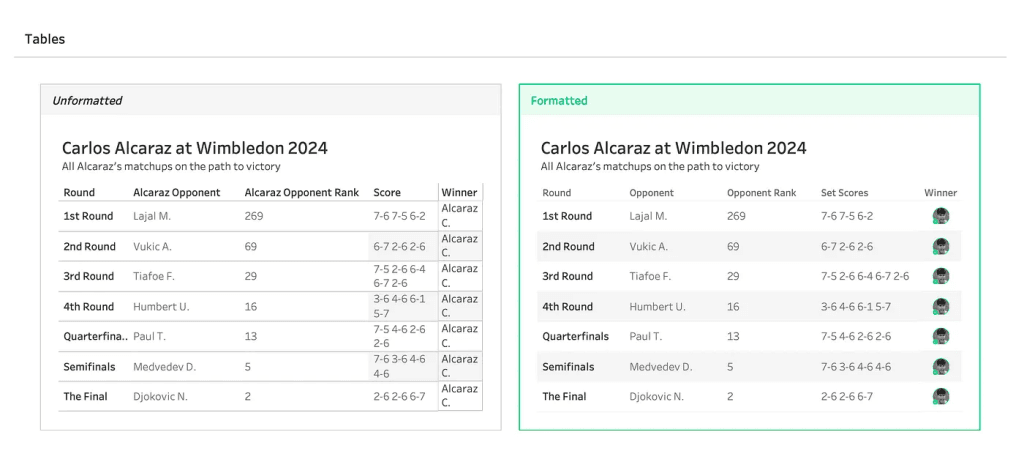
What makes this capability truly transformative is how it bridges Tableau’s trusted data layer with the flexibility of external tools. Whether you want to embed live KPI numbers into a…
The Tableau VizQL Data Service: What It Is, What It Can Do, and When to Use It Read More »