
Core Dataviz Style Guide Components
With Maxine Graze, you’re not left to guess how to audit your current charts, you’re walked through exercises like cataloguing your colours, checking contrast with real tools, and simplifying your…
With Maxine Graze, you’re not left to guess how to audit your current charts, you’re walked through exercises like cataloguing your colours, checking contrast with real tools, and simplifying your…
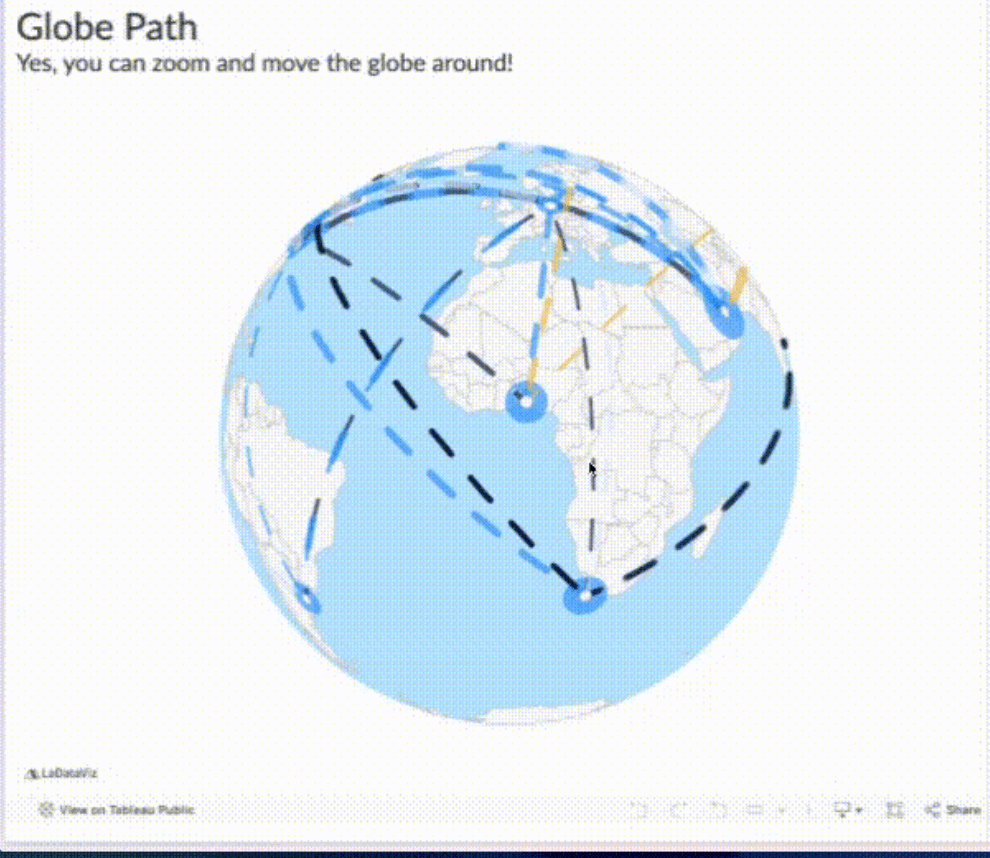
Tristan Guillevin and Jessica Bautista (at LaDataViz) are gearing up for a major milestone: full support for running their extensions on Tableau Public once the platform updates to version 2025.3.

Johan de Groot doesn’t just explain the problem; he gives you concrete, actionable workarounds to improve your dashboards without sacrificing accuracy. Whether you’re dealing with huge datasets or just want
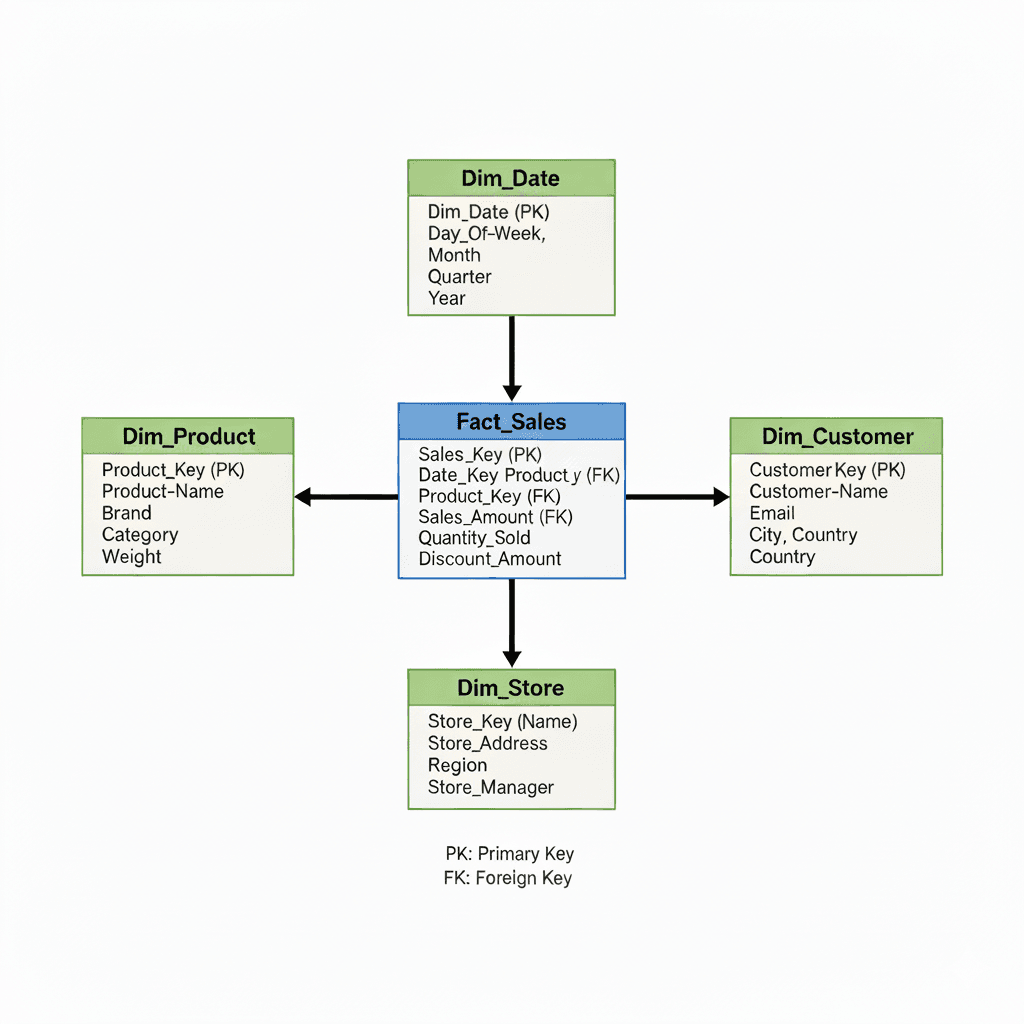
Beyond just theory, Tyler Green’s article is a practical trigger to rethink your current or upcoming projects: do you truly know the row-level meaning of your fact table? Are your

Brian Moore bridges the gap between “good design theory” and what you actually do next. Whether building dashboards for executives, for daily operations or for self‐service analytics, you’ll pick up
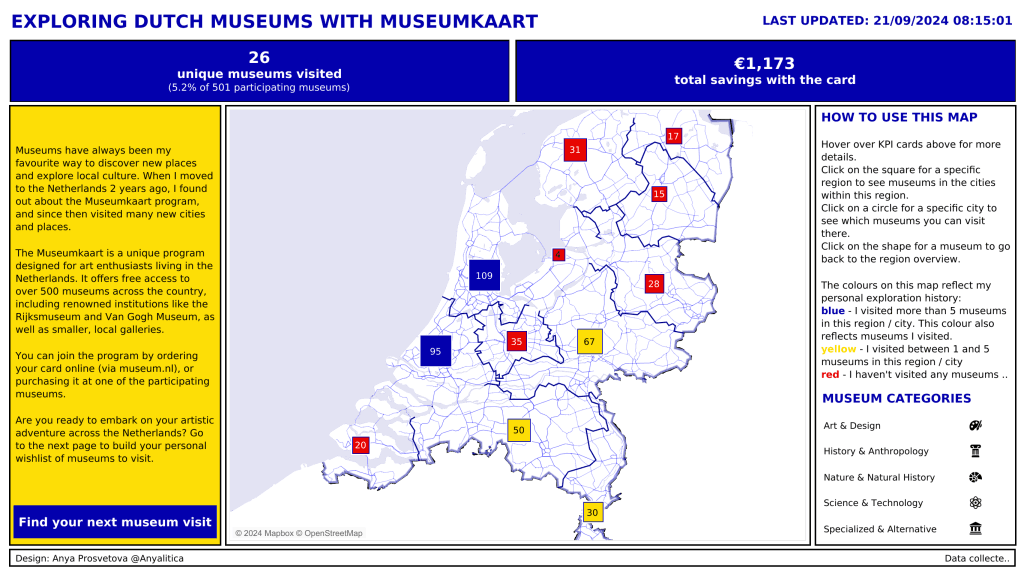
Anya Prosvetova blends the creative and the technical. It’s not just “how I built it” but “what I learned and how you can avoid the same hiccups”. Whether it’s discovering
5 Lessons Learned While Building a Map-centric Dashboard in Tableau Read More »
Even if you’re comfortable with the nuts and bolts of data tools, this article, by Michal Szudejko will stretch your view of what your work could do – giving practical
Beyond Numbers: How to Humanise Your Data & Analysis Read More »
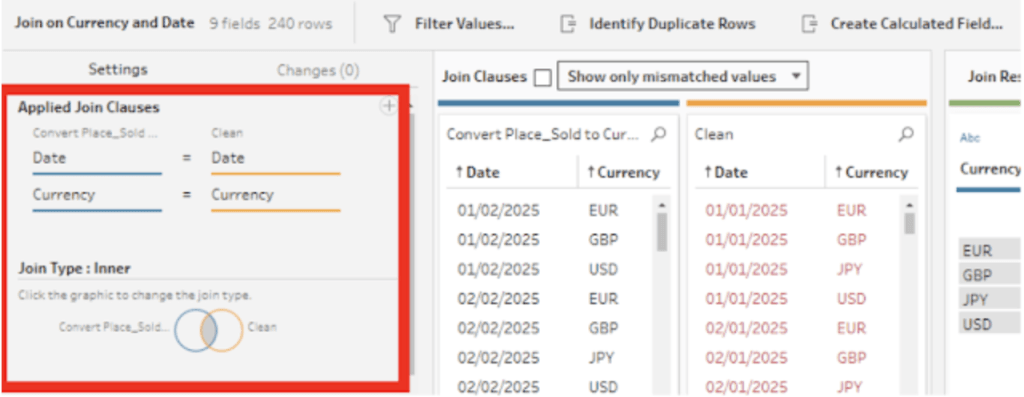
In Rosh Khan’s solution post, you’ll see the reasoning behind custom splits (e.g., breaking “Name” into “Game Title” and “Developer”), the importance of cleaning punctuation and spaces, the conversion of

Kyle Massey’s post marries practical code‑focused detail with architecture and governance insight. You’ll see real examples of metadata queries, field selection, aggregations, custom calculations, filters and even tips on mapping
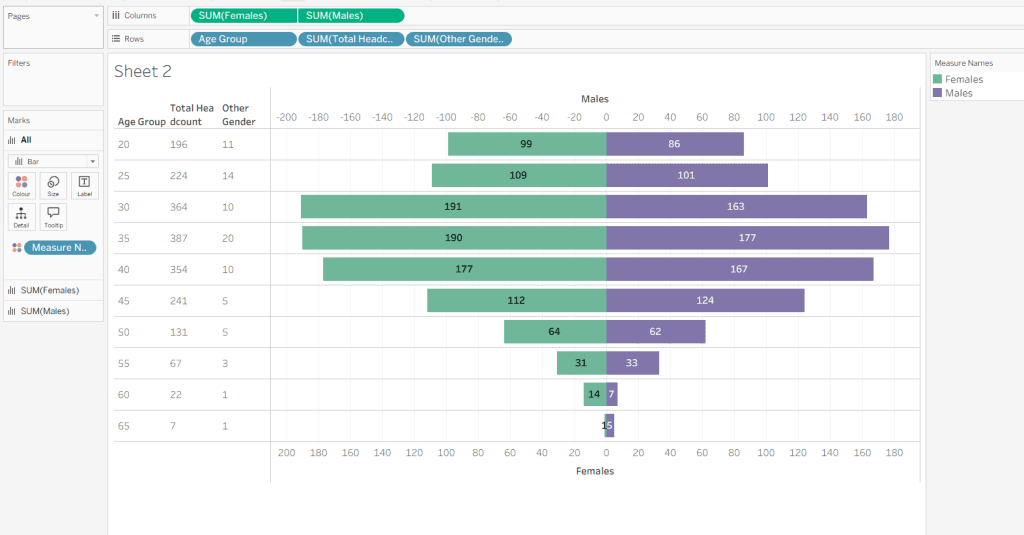
Even if you’re not a demographer, Donna Coles offers insights that apply to data-visualisation, analytics and planning. You’ll get ideas on how to interpret age and gender distributions, spot trends
