Why it’s Good to Show Bad Examples
This post with Alan Wilson dives into how one of the world’s leading companies leverages clean, impactful design to transform data into compelling narratives. From dashboards to presentations, Kraft Heinz…
This post with Alan Wilson dives into how one of the world’s leading companies leverages clean, impactful design to transform data into compelling narratives. From dashboards to presentations, Kraft Heinz…
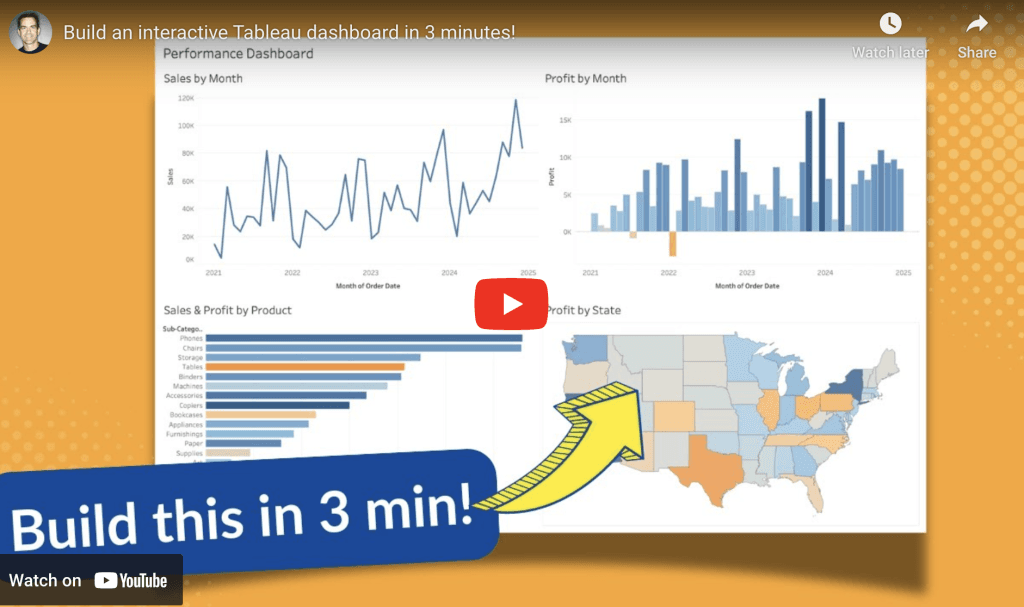
Andy Kriebel’s post is a masterclass in efficiency and simplicity. In his guide, he demonstrates how to streamline your dashboard-building process without sacrificing quality or clarity. It’s a must-read for
Build an interactive Tableau dashboard in 3 minutes! Read More »
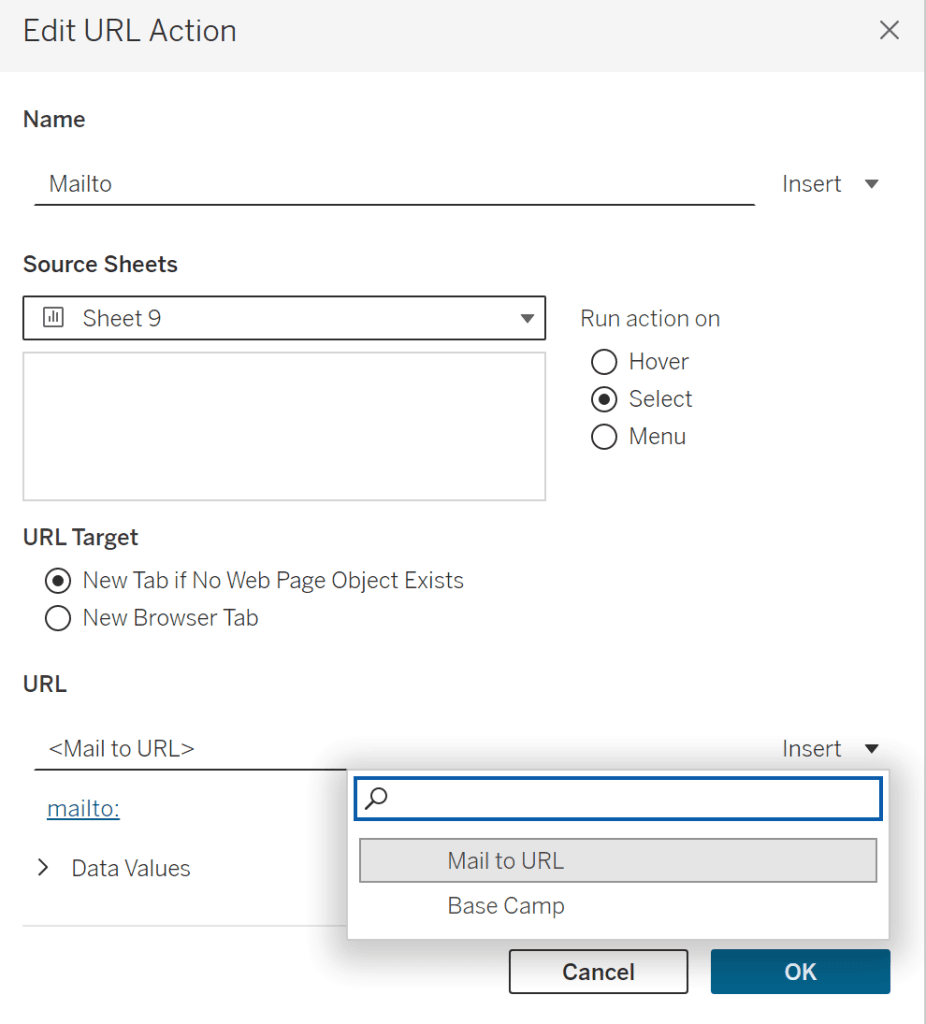
Imagine receiving the latest Tableau insights directly in your email inbox without ever needing to open the Tableau dashboard. Jules Claeys’ post shows you exactly how to make this a
If you’re looking to create Tableau dashboards that are not only powerful but also easy to maintain, Ann Pregler shares valuable strategies for designing dashboards that are intuitive to use

If you’ve ever wondered how data visualisation can transcend traditional analysis and become a form of creative expression, the Tableau Data Art Gallery is the perfect place to explore this
Announcing the Tableau Data Art Gallery: A Celebration of Creative Expression Read More »
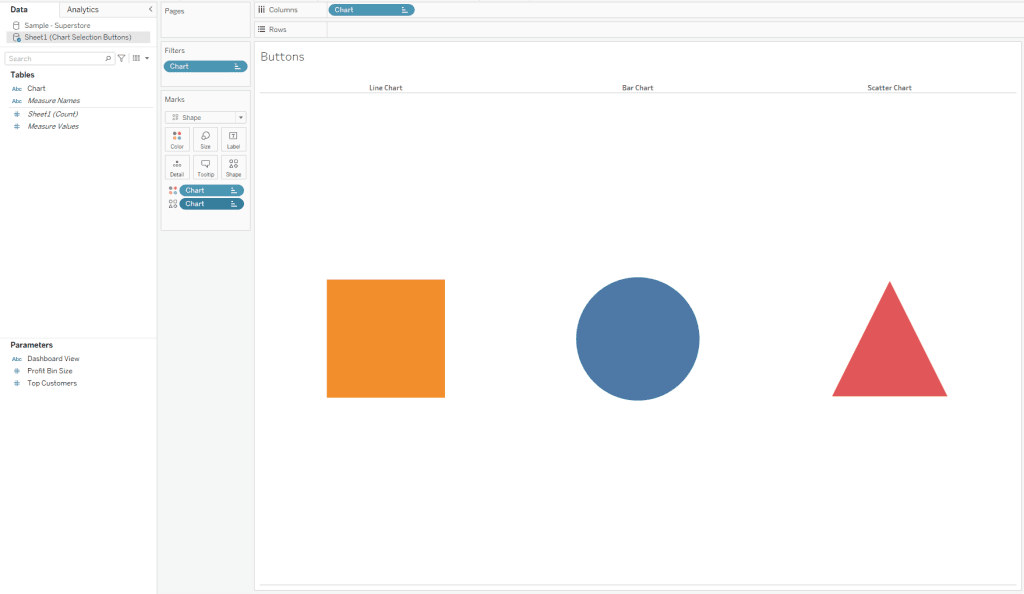
In this post, Liz Boika shows you how to use Tableau’s powerful zone visibility feature to control which dashboard elements appear based on user interactions. This adds a level of
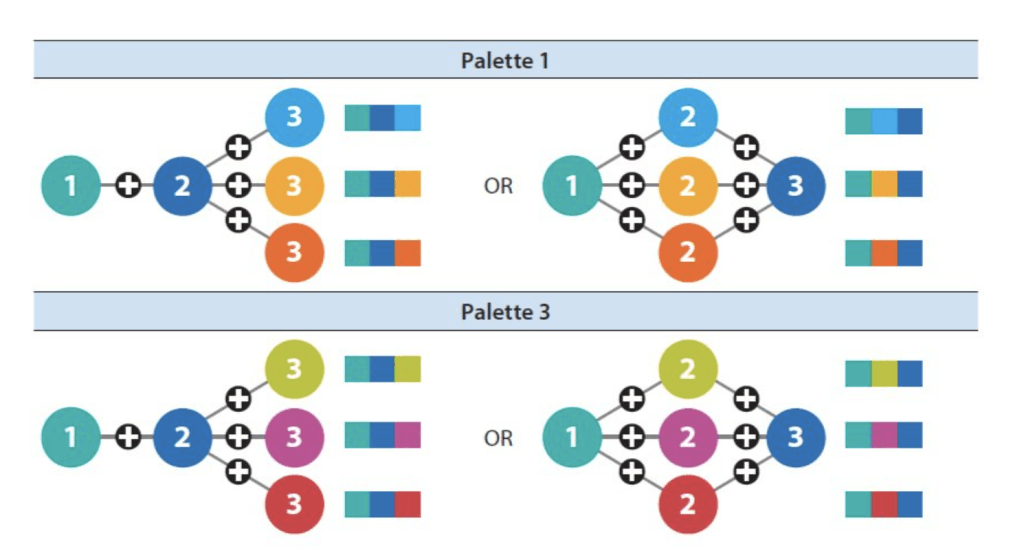
Choosing the right colours can make or break a data visualisation, and Jon Schwabish’s helpful post is a must-read for anyone looking to elevate their visual storytelling. He walks us
This post, by Rn Manogna covers the fundamental steps of loading data, analysing it effectively, and saving your work – all with practical, easy-to-follow advice. Their approach simplifies the often-complex

If you’re looking for a fast and effective way to rank and filter data in Tableau, Andy Kriebel’s post (on VizWiz) is a must-read. In his tutorial, Andy demonstrates how
How to Rank & Filter the Top 5 in Tableau in Under 60 Seconds! Read More »
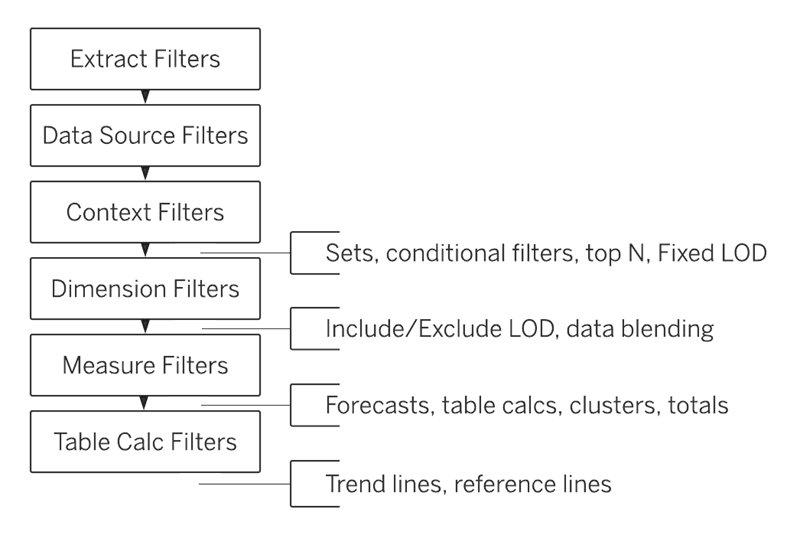
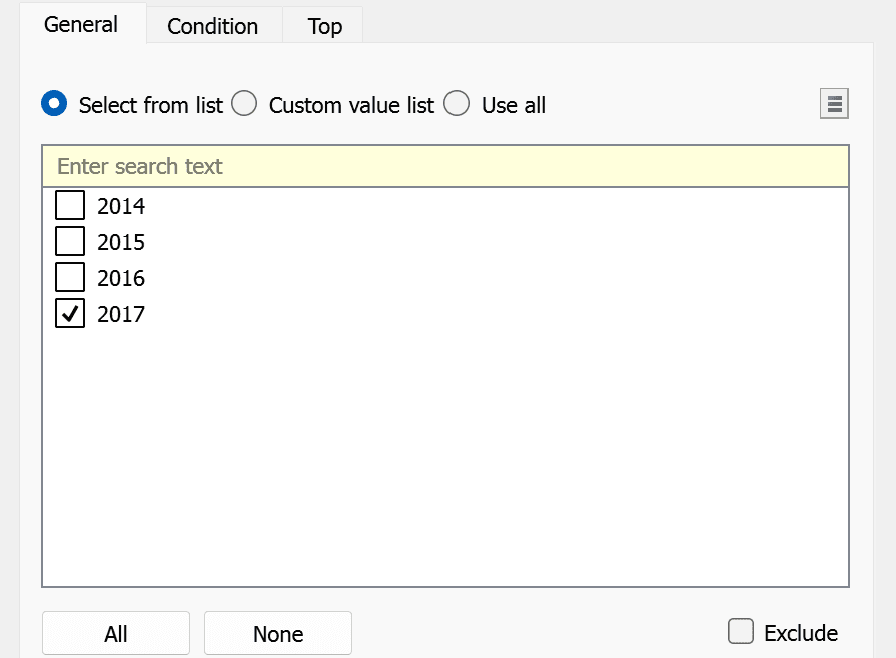
Context filters are a powerful yet often underutilised feature in Tableau that can help you refine your analysis and make your visualisations more efficient. In Rory Moxom’s guide, he breaks
