
Tableau API Authentication: A Deep Dive
In this post, Kyle Massey walks you through the ins and outs of Tableau’s API authentication – from setting up secure access to automating tasks, this post offers practical insights…
In this post, Kyle Massey walks you through the ins and outs of Tableau’s API authentication – from setting up secure access to automating tasks, this post offers practical insights…

In Anirudh Somada’s LinkedIn post, he reveals how to elevate your Tableau experience by integrating analytic extensions for advanced data analysis. If you’re looking to enhance the depth and precision

For anyone aiming to foster a robust data-driven culture within their organization, Josh Tapley’s structured approach helps ensure that everyone from executives to entry-level employees is equipped with the essential
Brittany Rosenau’s guide delves into the powerful technique of using polygons to create custom shapes and maps in Tableau. She breaks down what can seem like a complex topic into

Autumn Kloth’s review delves into Strachnyi’s advice on using colour strategically, which, in data presentations enhances readability and makes your visualisations more engaging. The review provides a clear summary of
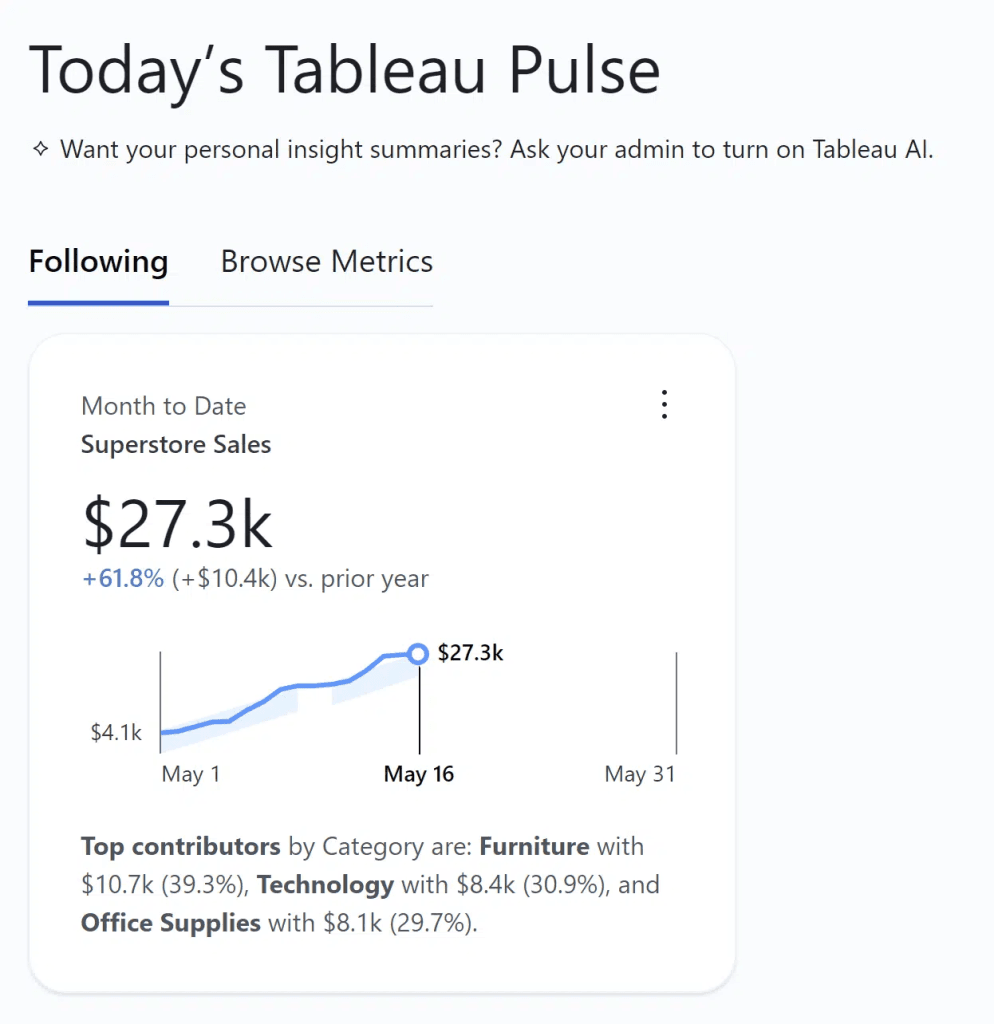
If you’re ready to take your data management to the next level, this comprehensive guide by Ethan Lang provides a step-by-step approach to activating and optimising Tableau Pulse – a
How to Enable Tableau Pulse and Ensure a Successful Launch Read More »
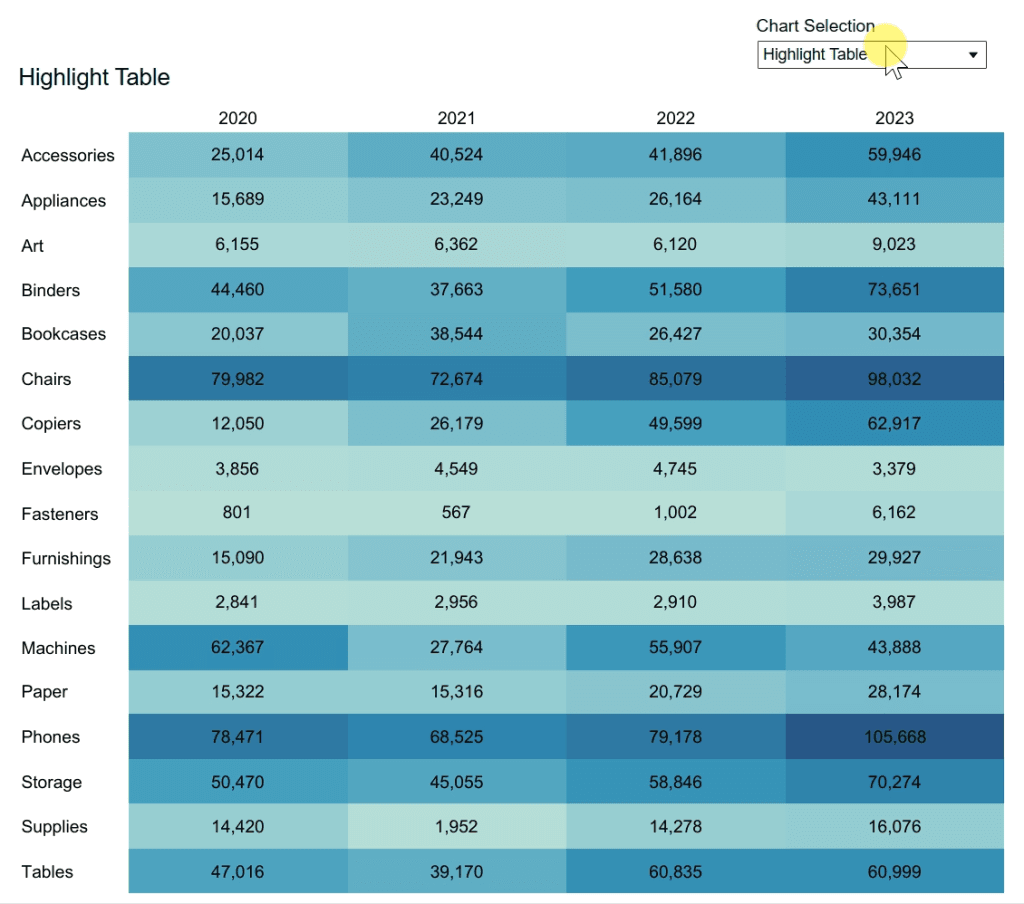
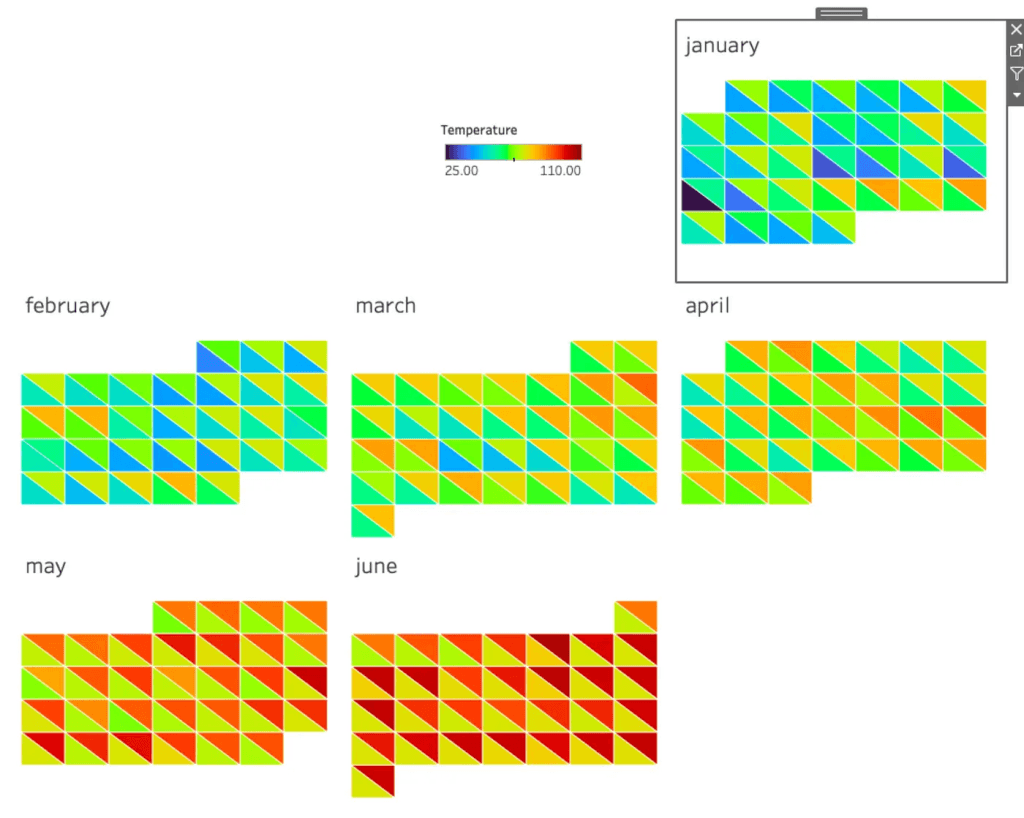
This step-by-step guide, by Dan Bunker, walks you through the process of creating heat maps – one of the most effective tools for identifying trends and patterns in large datasets.

If you want to take your Tableau visualisations to the next level, don’t miss this post by Andy Kriebel. It walks you through the process of creating and utilising custom
The What, Why, and How of Custom Dates in Tableau Read More »
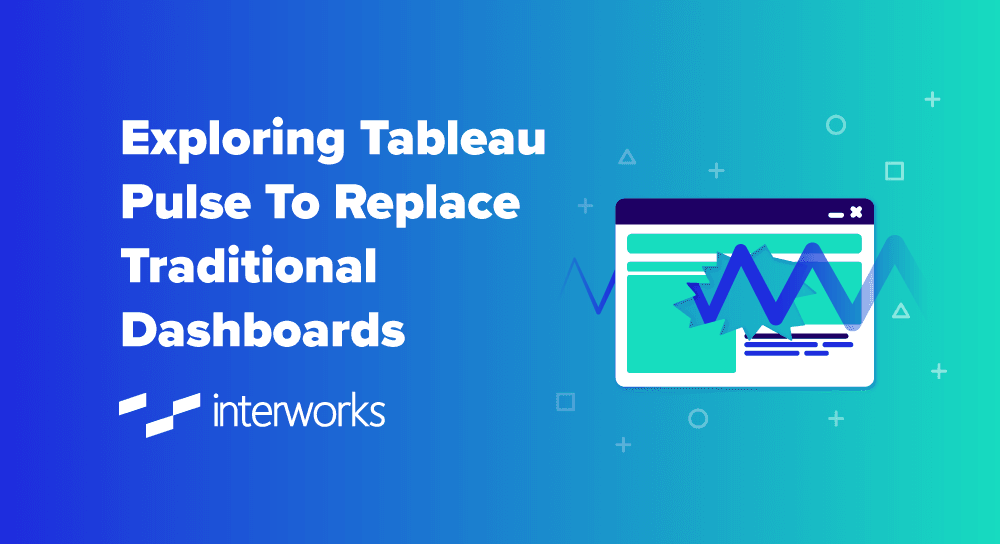
Robert Garcia’s article delves into how this innovative tool can transform the way you monitor and analyse key metrics. By offering real-time data insights and more flexible reporting, Tableau Pulse
Exploring Tableau Pulse To Replace Traditional Dashboards Read More »

Enhance your Tableau knowledge with this post by Yvette Kovács. Her detailed guide walks you through how to use the ASCII function to return the ASCII code of the first
