
Tableau Next Tips #1 : Tableau Next Edition
Beyond the UI, Tarun Gupta’s article explains which editions of Salesforce support Tableau Next and how this new platform blends the power of Tableau, Data Cloud, and Salesforce automation. If…
Beyond the UI, Tarun Gupta’s article explains which editions of Salesforce support Tableau Next and how this new platform blends the power of Tableau, Data Cloud, and Salesforce automation. If…
Lahav Ararat’s step-by-step breakdown of how to configure Okta so Tableau can connect to Snowflake without interactive multi-factor prompts is particularly helpful if you’re handling automated workflows or scheduled extract
Tableau Snowflake Connection (Okta username & password) Read More »
Rod Sardari’s video also demonstrates why using county names alone can cause problems in Tableau, since many county names are not unique (for example, Dallas County exists in multiple states),
Geocoding Using Census GEO IDs in Tableau | GIS & Data Visualization Tutorial Read More »
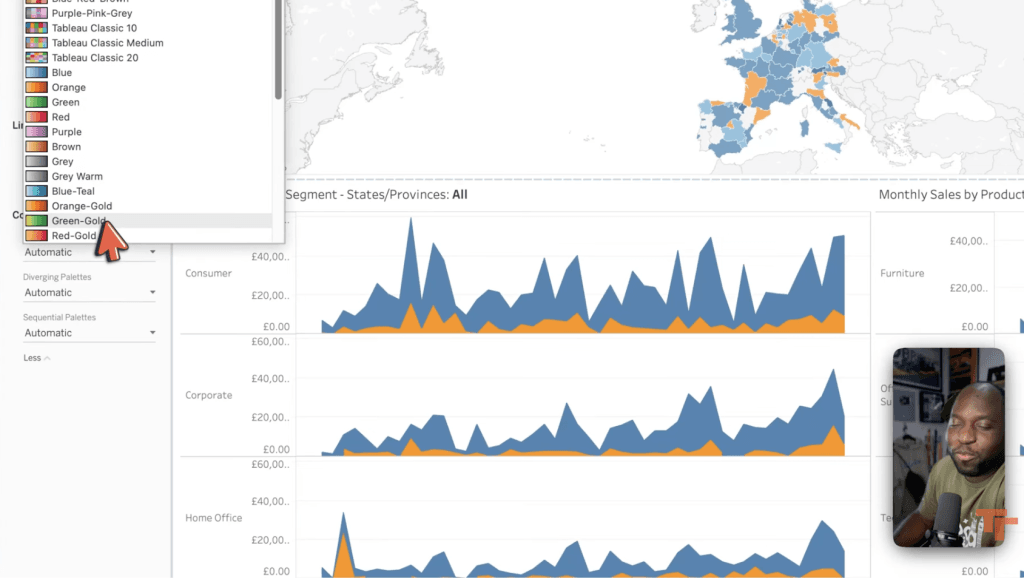
Tim Ngwena also covers how to navigate the Format options and efficiently create, save, and apply your custom colour palette. By the end, you’ll know how to maintain consistent colours
What really sets this piece apart is that it goes beyond the basics by addressing common limitations and offering a clever, real-world solution. It shows you how to work smarter
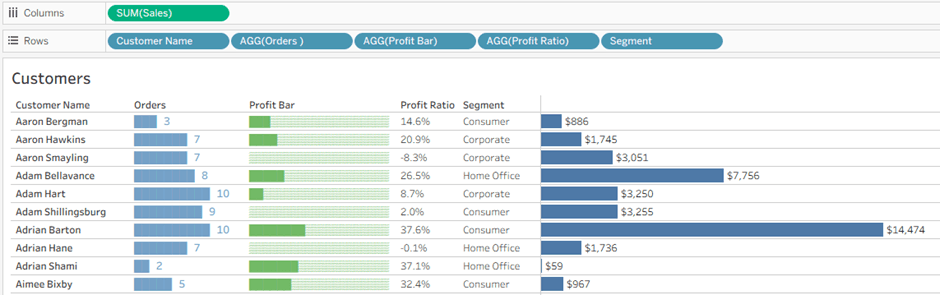
Dan Chissick’s article offers thoughtful insight into design choices and practical use cases. It’s especially useful for anyone looking to enhance readability and storytelling in their BI reports. If you

This podcast with Nisar Ahmed and Mike Cisneros blends human stories with data wisdom. Through childhood memories, hockey analogies, and reflections on flow states, they uncover deeper truths about how
Wait for it: This Isn’t Sport Talk Radio… It’s Data Storytelling Read More »

This episode isn’t just for practitioners, it’s for anyone who wants to deepen their understanding of why we visualise data the way we do, and how thoughtful questioning can unlock
Data + Love – Data fluency and questions in Dataviz Read More »
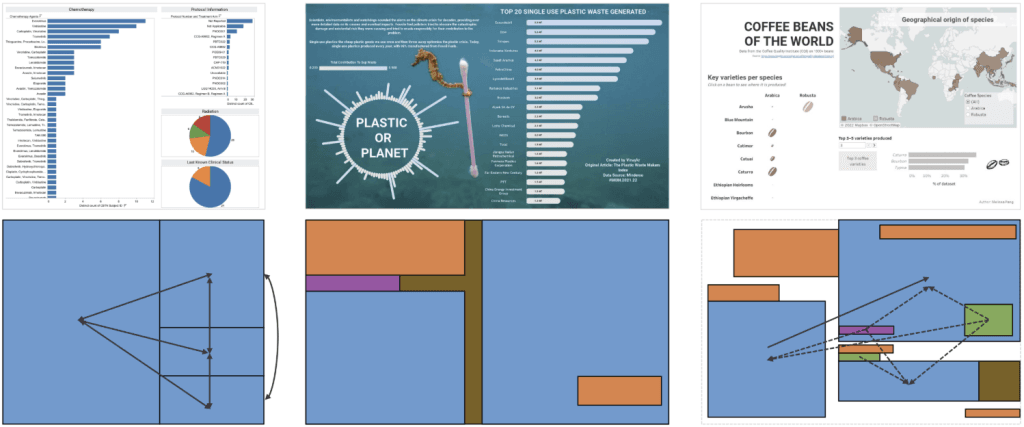
What makes this research particularly valuable, is that it goes beyond rules of thumb to quantify what actual authors do at scale. You’ll discover why text matters more than most
From a Dashboard Zoo to Census: Understanding Dashboard Design at Scale Read More »
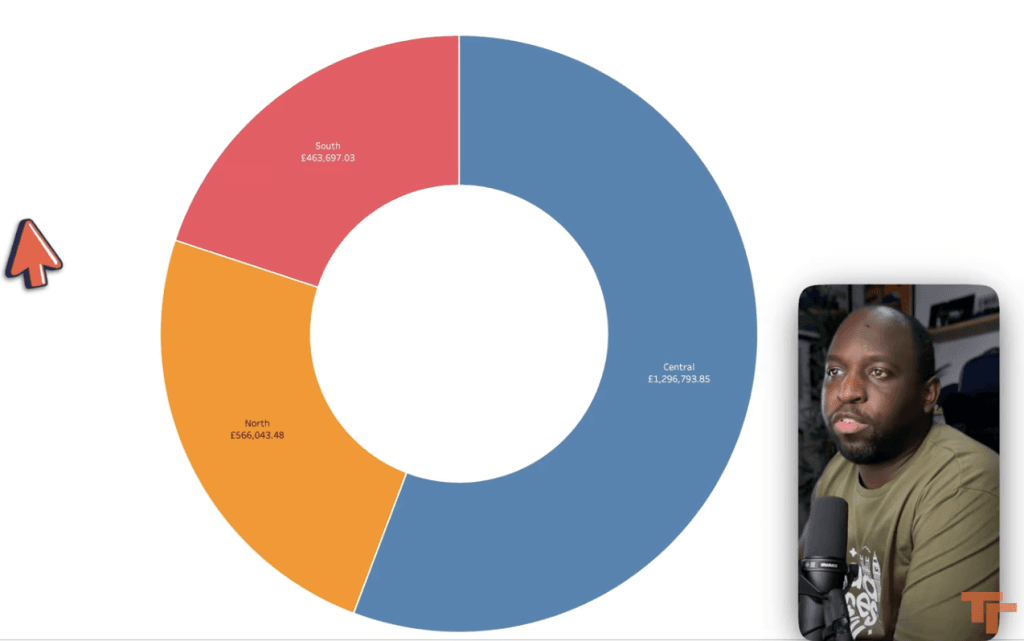
The Tableau 25.3 release introduces a powerful new radial chart extension that finally lets you create doughnut charts, gauges, and multi-ring visuals without relying on clunky pie-chart hacks. In this
Tableau’s New Radial Chart Type | Tableau 2024.2 and Newer Read More »
