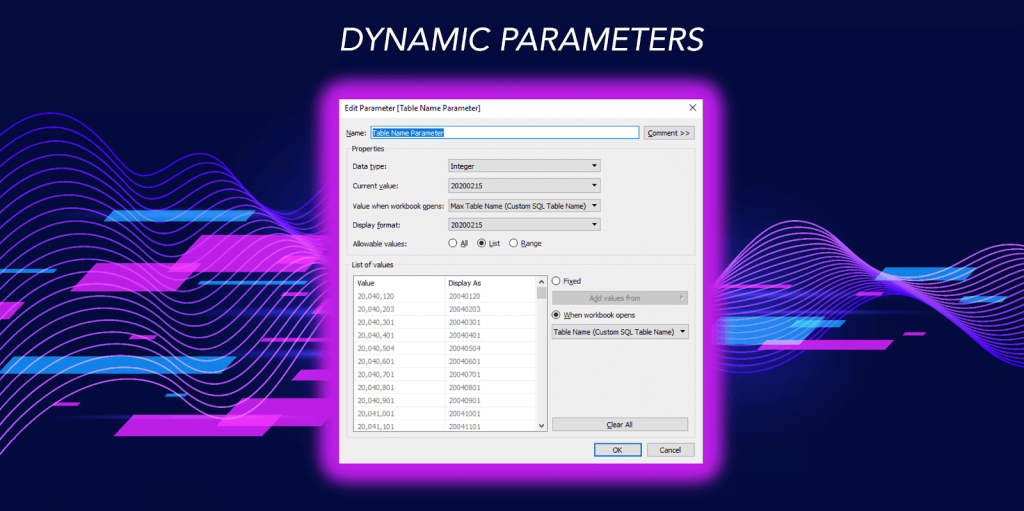
Creating UpSet Plots in Tableau By Chris Love
Zen Master Chris Love shows you how to build UpSet Plots, which is an alternative chart type to building venn diagrams, which are difficult to build in Tableau. UpSet Plots…
Zen Master Jeffrey Shaffer highlights some best practices for text alignment on your Tableau dashboards. Jeffrey explains how text alignment in Tableau can be used appropriately while identifying different scenarios
The second of two Zen Masters to feature in the first Tableau Bites of 2020 is Andy Kriebel, who has another Tableau Tip up his sleeve with using distribution lines
Using Distribution Lines to Provide Space for Labels By Andy Kriebel Read More »
Zen Master Klaus Schulte highlights two ways of encoding change in Tableau-created line charts. Klaus uses the Step Line Type approach where he builds his line chart manually in Tableau
The Zen Masters keep coming as Ryan Sleeper has yet another clever tip up his sleeve towards creating better relative date filters over 7, 30 and 90 days in Tableau.
DataBlick’s Anya A’Hearn explains how Tableau users could modify their desktop dashboards to become more mobile-friendly, as well as highlighting how it could make the traditional KPI dashboard more modern.
FEEDING THE SCREEN-TIME BEAST WITH SHIFTING MOBILE METRICS Read More »
The newest version of Tableau (2019.2) beta was released in March. They’re revving up the way you interact and tell stories with your data. Emily Chengives a quick overview of
NOW IN BETA: VECTOR MAPS, PARAMETER ACTIONS AND NEW ASK DATA FUNCTIONALITY Read More »
Tableau Zen Master, Ken Flerlage, spends a lot of time answering questions on the Tableau Community Forum and one common problem he sees is missing dates. For instance, you may
This site is all about sharing real life dashboards. Dashboards made by real Tableau users. The purpose isn’t to show off clever charts, or amazingly designed infographics from fun personal
Ryan Sleeper talks about his favourite question to ask when presenting on Tableau and data visualization: Why do you visualize data? He then gives insight into discussing data visualization with
WHY DO YOU VISUALIZE DATA? WAYS TO DISCUSS WITH STAKEHOLDERS. Read More »