ENCODING CHANGE IN TABLEAU LINE CHARTS

Want to Get Latest Updates and Tips on Tableau Blogs

a082da86 7310 4a28 9a9b 7726653cb2b9.jpg

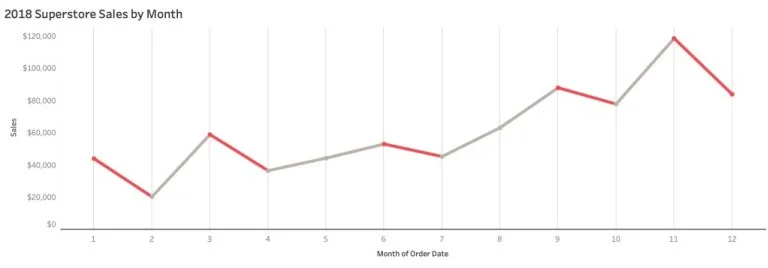
Zen Master Klaus Schulte highlights two ways of encoding change in Tableau-created line charts.

Klaus uses the Step Line Type approach where he builds his line chart manually in Tableau and creates a dual axis to encode change in the chart. He also mentions that you can use this approach with a Regular Line Type by using Parameters to achieve this result.

Read Original Article…

Share This Post:

001 database

Tableau Training on
Tap Fast Track

data scientist 1

Tableau Advanced Analyst

002 bar chart

Tableau
Foundation

003 network

Tableau Training
on Tap

Share :

Leave a Comment

Your email address will not be published. Required fields are marked *