
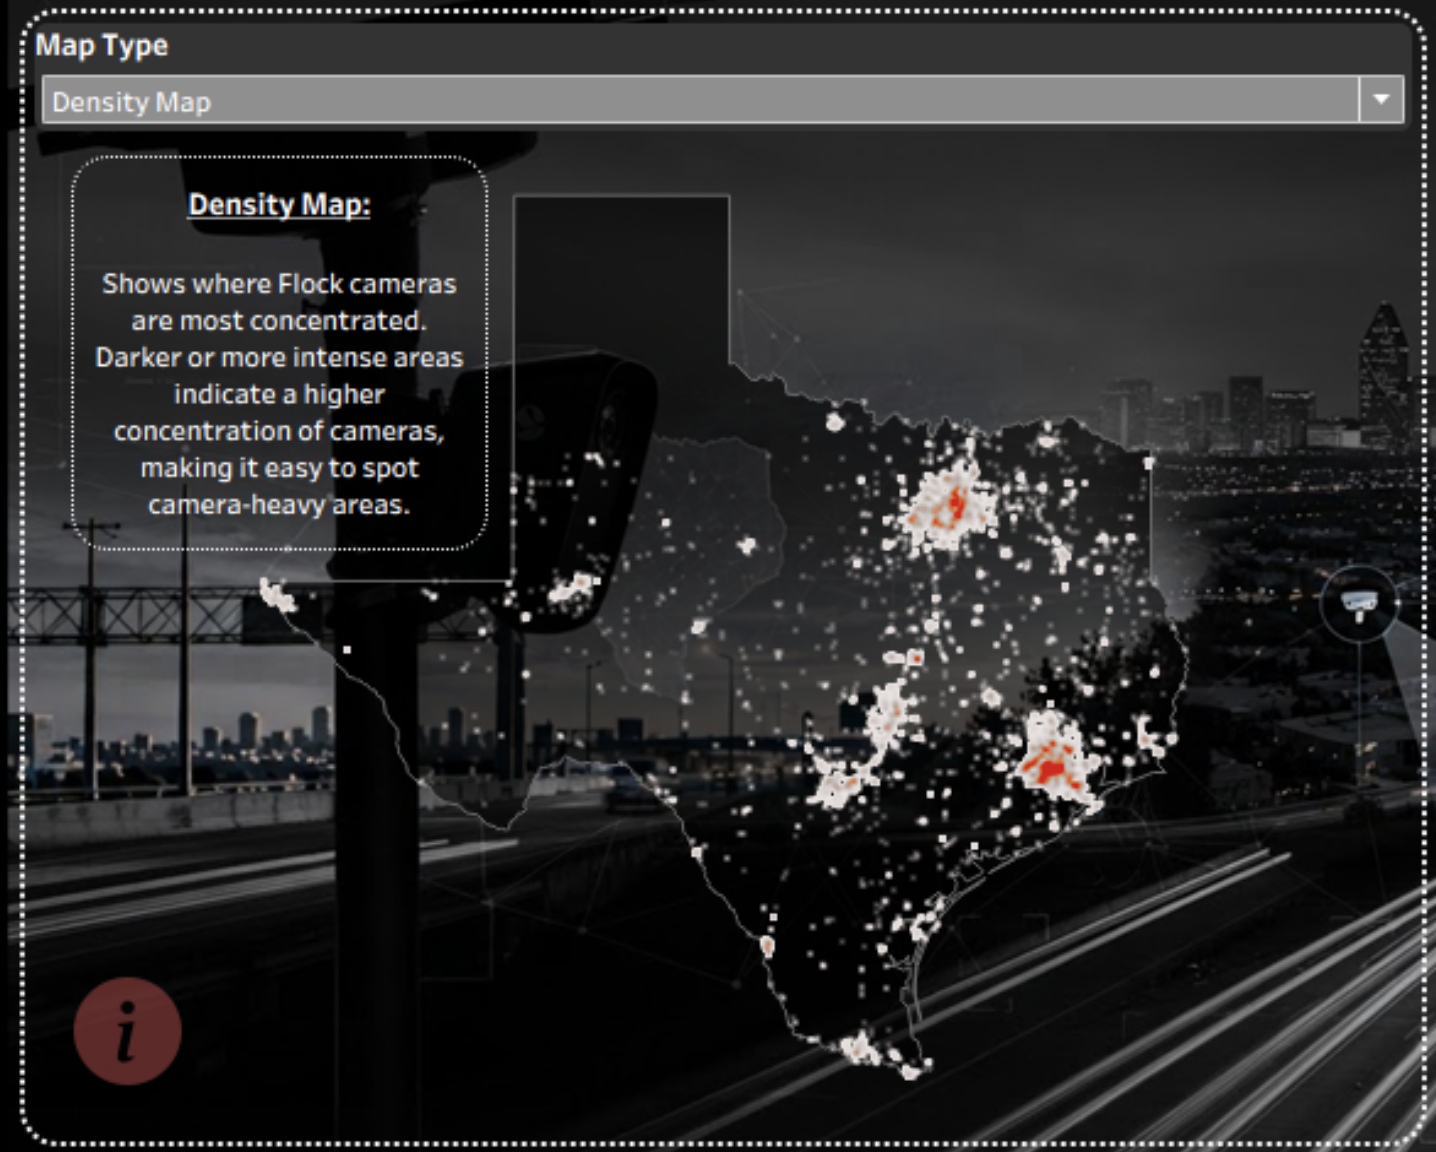
Rafael Guevara pulls every licence plate reader camera in Texas from OpenStreetMap's Overpass API and turns 16,750 points into a Tableau dashboard. One parameter switches between a density map, a custom shape map and a dual-layer map with city totals. He gives step-by-step instructions for a doughnut chart with a Texas silhouette in the middle, then shares three handy extras: an info icon built from a one-mark sheet, a clickable header image using a transparent floating sheet, and a True/False filter action that removes the highlight after a click.
Don’t Mess With Texas; It’s on Camera: Mapping ALPR Flock Cameras with OpenStreetMap and Tableau
Want to Get Latest Updates and Tips on Tableau Bites Blogs?

Tableau Training on Tap Fast Track

Tableau Training Analyst

Tableau Training Foundation
