Ok, this is probably not a big thing, but I have been thinking about it for quite a while now: How can I encode change in line charts accurately?Wait: Encoding change in line charts?Change is of course already encoded in line charts. For example, when we look at Superstore sales by month we can see the change: when the line goes down, we have a negative change compared to the previous month and when the line goes up, we have a positive change.
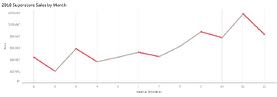

Tableau Training on
Tap Fast Track

Tableau Advanced Analyst

Tableau
Foundation

