While one article was not enough, we have a second how-to from Playfair Data’s Ryan Sleeper. Ryan shows you how to make the connected scatter plot by connecting the marks by year to the dots in Tableau.
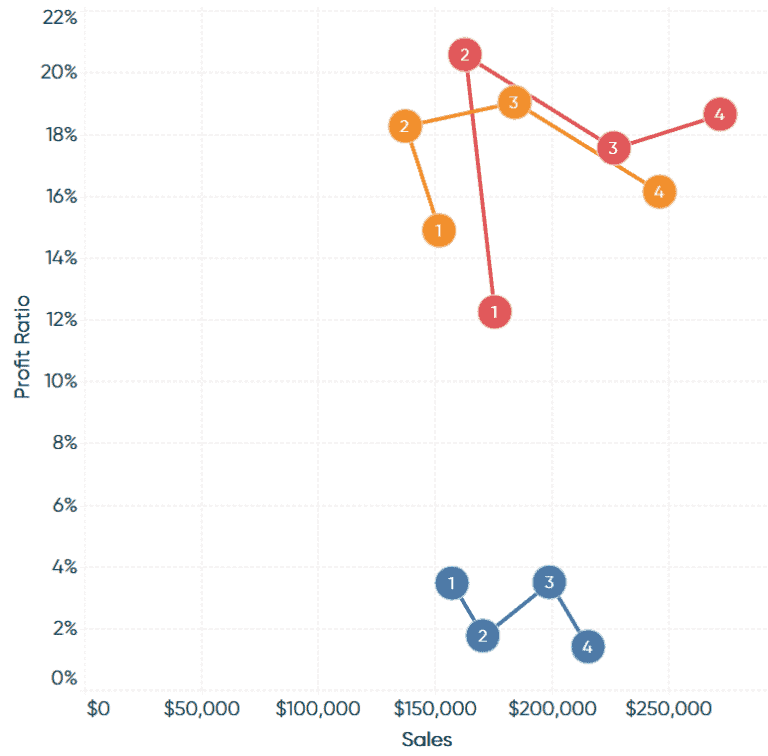

Tableau Training on
Tap Fast Track

Tableau Advanced Analyst

Tableau
Foundation

