
Table calculations in Tableau – the pièce de résistance that lets you tweak your data display without mucking about with the raw numbers. They come into play right after all your filters and custom calculations have had their say, but just before Tableau serves up the final visual dish. Let’s dive into why these calculations are the unsung heroes of your dashboards.
What Makes Table Calculations Delightfully Different?
Table calculations are like the backstage crew of your data visualisation – working their magic behind the scenes but utterly dependent on the initial setup.
- Order of Operations: Table calculations are the last to take affect, meaning they don’t interfere with the original data source – they just reshape what you see.
- Dynamic Darlings: These calculations adjust as you add or tweak dimensions in your view. Think running totals, moving averages, and percent-of-total calculations.
This flexibility, while fabulous, can be a bit of a double-edged sword. Alter the structure of your visualisation – say, by removing a dimension – and you might find your results doing an unexpected jig.
Table Calculation Filters: The Art of Illusion
One of the trickiest bits with table calculations is grasping how they dance with filters. A misstep here can lead to surprises.
Table calculation filters are applied after Totals, Table Calculations, Forecasts, and Clusters.
This means that when you use a table calculation filter, it will only affect the data that has already been processed by these previous steps. Consequently, your visualisations will first aggregate data, apply any necessary calculations, generate forecasts, and define clusters before the table calculation filter is executed.
This sequence ensures that the final data presented in your dashboard reflects all prior manipulations and insights, maintaining the integrity and accuracy of your analysis.
Table Calculation Filters merely hide data from view. The data remains in the calculation context, making them perfect for maintaining integrity in calculated fields like running totals.
Pro Tip: To display a running total while keeping certain months hidden, use a table calculation filter. This keeps the months in the calculations but out of sight.
Here is an example where on the left we are showing 4 years worth of running total data:
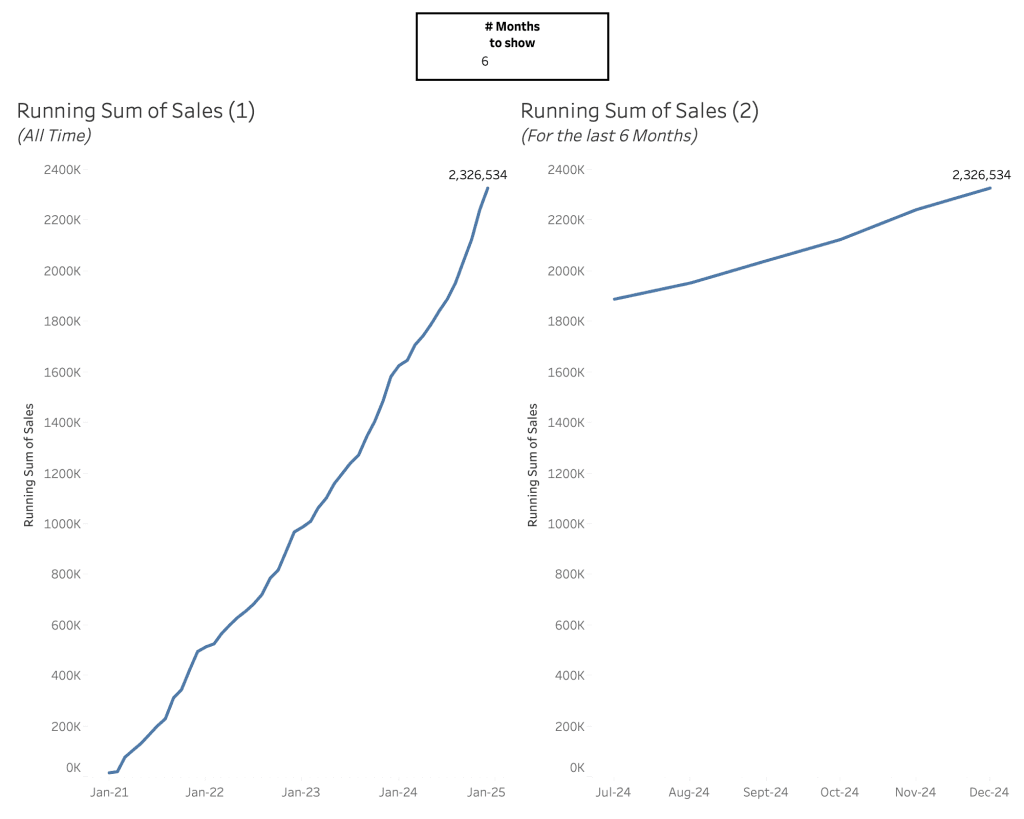
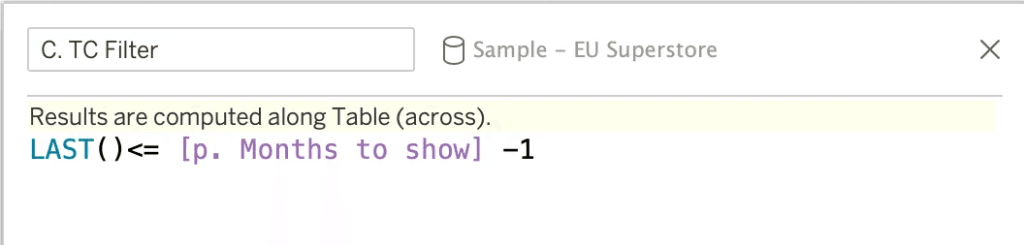
On the right we have applied the following Table Calculation filter and set it to “True”, as it is a boolean outcome – a very common and flexible way to set up calculations for filters:
The Final Flourish: Rendering & Formatting
Once calculations have done their thing, Tableau applies the final touches. This ensures your table calculations work seamlessly with your design before the curtain rises.
Here’s what takes place after Table Calculations:
- Trend Lines and Reference Lines: Added post-calculation to provide extra context.
- Visual Design Elements: Everything from colour schemes and annotations to label positioning and mark sizes.
- Other stuff: Titles, tooltips and any dynamic interactivity.
You will want to check that these last few steps are indeed behaving the way you want them to.
What’s Next?
The fifth and final part of this series will be your go-to guide for troubleshooting Tableau dashboards. From fixing broken views to untangling calculations, we’ll explore strategies to keep your dashboards working the way you want them to.
Whether you’re giving your dashboards a facelift or crafting them from scratch, mastering table calculations gives you the edge in transforming data into insights. Keep exploring and experimenting – the possibilities with Tableau endless.
And if you want to go deep on this, then join our next Tableau Training on Tap Level Up course and / or join our TToT Insights Community to apply these learnings to your own data.
E.g. This article was featured in Tableau’s Weekly Roundup.


