Tutorial: Picture-Perfect Pie Charts
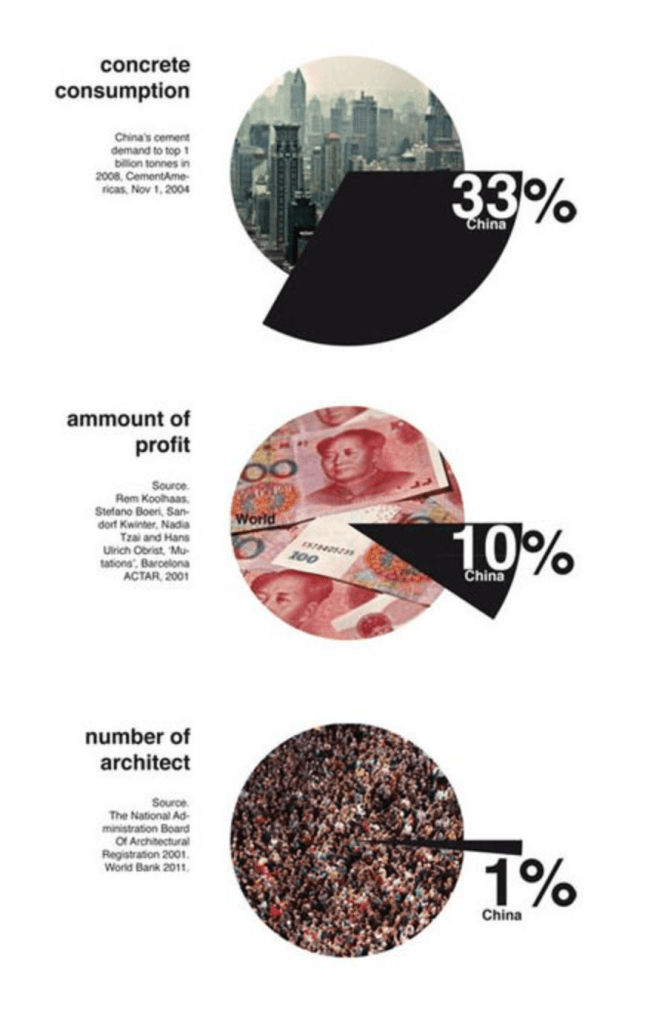
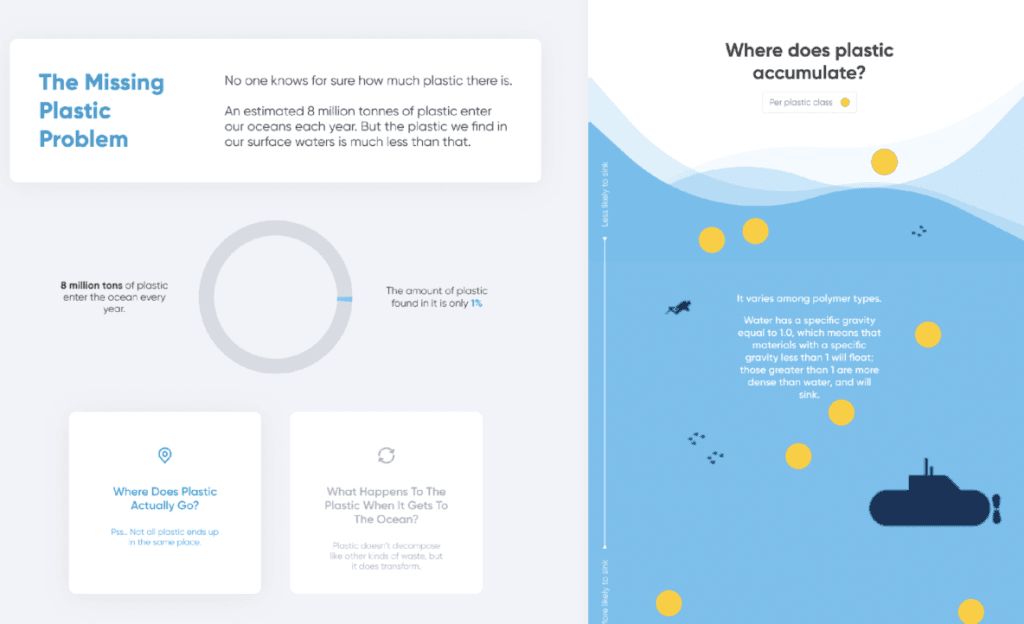
Pie charts are a popular visualisation tool, but creating one that is both clear and effective can be tricky. Here, Lisa Trescott provides a step-by-step guide on how to create…
Pie charts are a popular visualisation tool, but creating one that is both clear and effective can be tricky. Here, Lisa Trescott provides a step-by-step guide on how to create…
Creating a scatterplot in Tableau should help you visualise relationships between variables, but what if your chart ends up as just a single point? Ann Pregler walks us through why
Why Is My Scatterplot a single point? (Tableau Troubleshooting) Read More »
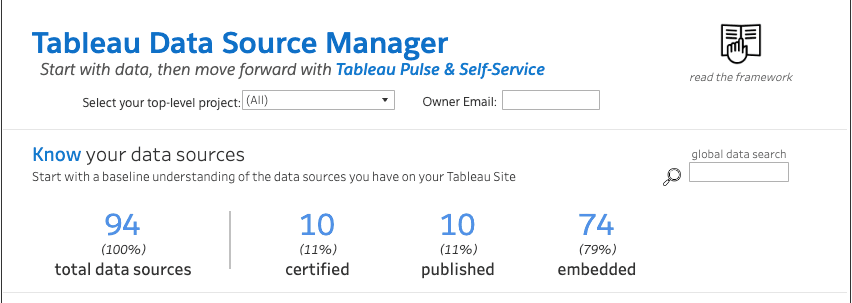
Having clean, well-prepared data is the foundation of any successful analytics strategy, and Tableau Cloud offers powerful tools to help you achieve just that. Here, Francis Dejonckheere dives into essential

Bar charts are one of the most common and powerful data visualisation tools, but poor design choices can reduce their effectiveness. Johan de Groot’s insightful post walks you through the

The world of analytics is evolving faster than ever, and staying ahead of the curve is essential. As businesses increasingly rely on data to gain a competitive edge, understanding trends
Emerging Trends in Analytics for 2025 and Beyond Read More »
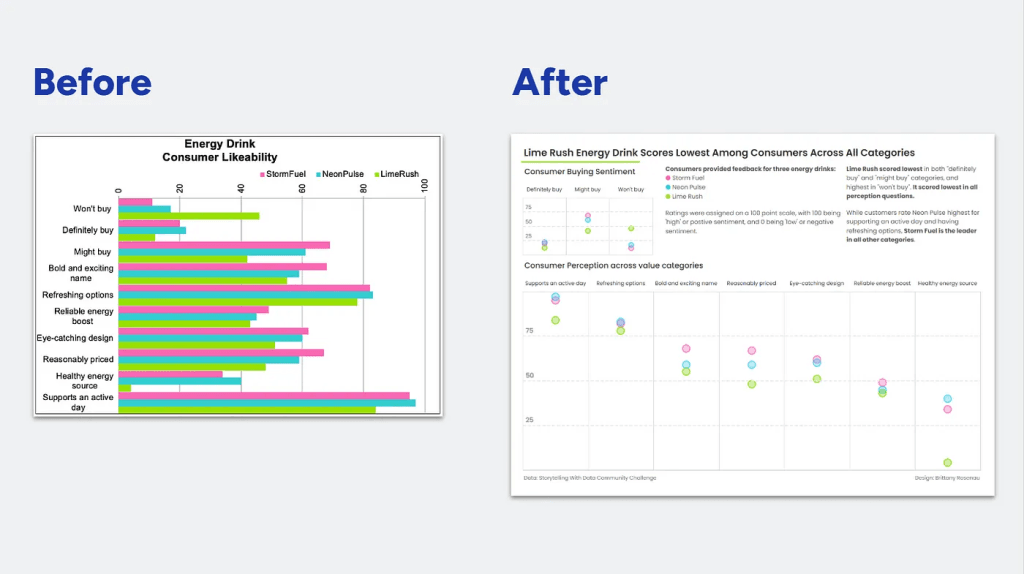
Small design choices – such as how elements are positioned and spaced, can significantly impact how an audience interprets and absorbs information. Brittany Rosenau breaks down practical techniques and real-world
Storytelling with Data Community Exercise — Use Space and Alignment Effectively Read More »

If you want to create impactful data visualisations that truly resonate, this Playfair Data post with Ryan Sleeper is a great read! Showing how the best dashboards go beyond raw
The Parallels Between Storytelling and Data Visualization Read More »
Combining data from different sources can often lead to performance issues, mismatched fields, and inaccurate results. Felicia Styer provides expert advice to help you efficiently bring together separate datasets, ensuring
Bringing Tables Together: Working Across Independent Data Sources in Tableau Read More »
Adam MIco dives into the world of Tableau Visionaries – the thought leaders who are pushing the boundaries of innovation, storytelling, and AI-driven insights in the Tableau community. As data
Looking Ahead: Tableau Visionaries and the Next Era of Data Read More »

If you’re considering a career pivot into data analytics, Sam Priddy offers words of advice to help you develop both the technical skills (like SQL, Python, and Tableau) and soft
5 Tips to Accelerate Your Analytics Career Transition Read More »
