Labelling Top N in a View with Rank Calculation
Gordon Hack from The information Lab’s Data School has a tip up his sleeve as he shows you how to label the Top N in a View with a Rank…
Gordon Hack from The information Lab’s Data School has a tip up his sleeve as he shows you how to label the Top N in a View with a Rank…
In this edition, I have had a post, which has an overview of five new features in Tableau 2020.3, but there’s one feature in this update that has caught my
Tableau 2020.3 has come out with a whole raft of new features, designed to bring more insights and analysis from your dashboards and visualisations.Kevin Flerlage details five new features in
Five Awesome New Features of Tableau Version 2020.3 Read More »

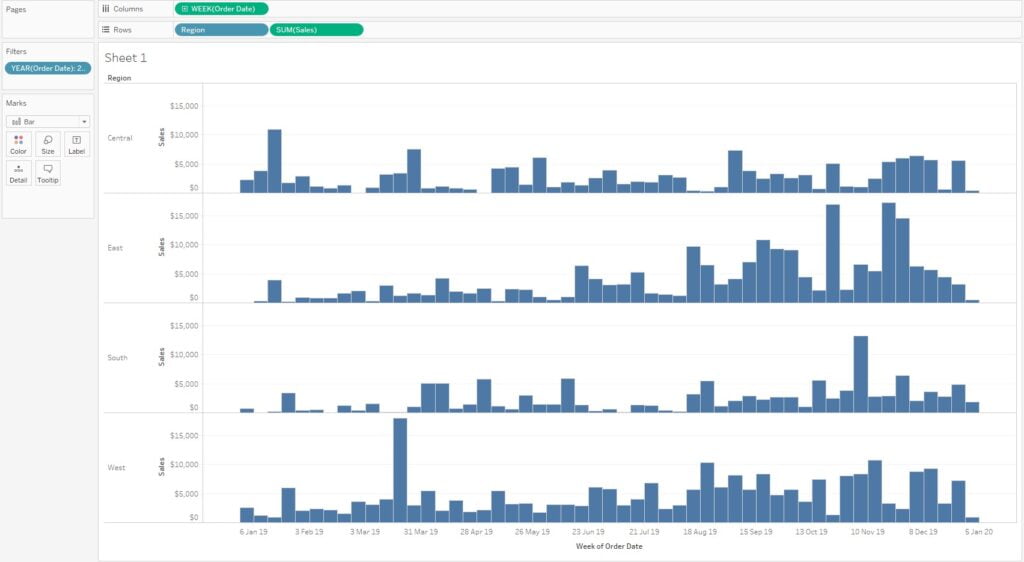
Wondering where to begin when you have some spatial data and you need to create a map in Tableau?Zen Master Bridget Winds Cogley has five calculations that can be used
How the EXCEL do I start spatial analysis in Tableau? 5 calculations and a lot of fun! Read More »
Microsoft Excel will always hold a special place in my heart. Learning how to automate excel through VBA is what made me interested in coding and eventually lead me to
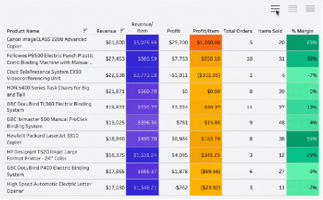
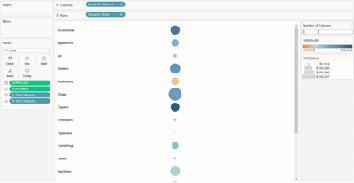
How to Build a Pivot Table in Tableau By Katrina Johnson Read More »
Oftentimes, we want to show the labels on charts, but there may be cases where we need more flexibility than the default options Tableau provides. For example, we may only
Take Control of Your Chart Labels in Tableau By Gheorge Ghidiu Read More »
Shortly before The Big Book of Dashboards was published, I had the good fortune to attend Cole Nussbaumer Knaflic’s Storytelling with Data workshop. Great content, great presentation, and I got…
Should you use dashboards to tell stories or to find stories? By Steve Wexler Read More »
This is the third blog in a short series on Tableau’s animation feature, available in releases 2020.1 and higher. This series looks at the fundamentals of animation and how they
Getting Animated Part 3 – Scatter Plots in Tableau By Mark Edwards Read More »
Have you ever struggled to fit what you want to into a single screen when you’re using Tableau? Representing your data in a grid or matrix can really save space
Tableau How-to: Create dynamic grids without changing your data By Joe Pickin Read More »
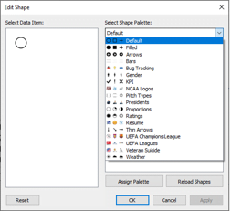
If you’re like me, nothing excites me like bringing a dashboard to life using proper shapes and colors. In this blog post I will show you three different techniques on
