This is the third blog in a short series on Tableau’s animation feature, available in releases 2020.1 and higher. This series looks at the fundamentals of animation
and how they affect the core chart types that we tend to use in Tableau. Part 1 looked at line charts, and part 2 focused on bar charts. Now, let’s move on to
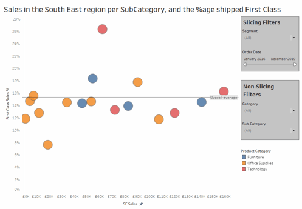
scatter plots.I think that, for a lot of users, comprehending how animations work helps understand so much about the inner workings of Tableau, and reveals what you’re actually seeing on the page. More on that later. First, let’s get stuck in.
Getting Animated Part 3 – Scatter Plots in Tableau By Mark Edwards
Want to Get Latest Updates and Tips on Tableau Bites Blogs
Sign Up For Newsletter