QUICK TABLEAU TIP – HOW DO YOU ADD ‘+/-‘ OR ‘▲/▼’ TO LABELS?
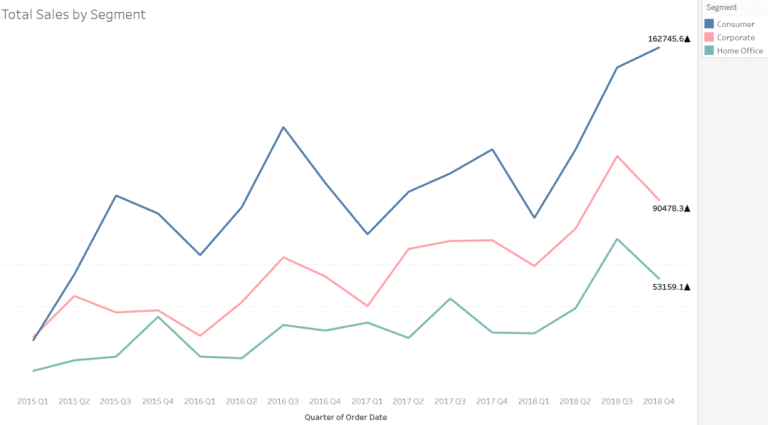
Sara Hamdoun from the Data School, shows us this simple yet neat tip for indicating whether a number is positive or negative. In this example, she uses the Sample –…
QUICK TABLEAU TIP – HOW DO YOU ADD ‘+/-‘ OR ‘▲/▼’ TO LABELS? Read More »