Tableau Zen Master, Ryan Sleeper, explains how Unit histograms, or Wilkinson dot plots, show distributions of individual data points instead of bucketing them into bins like traditional histograms.
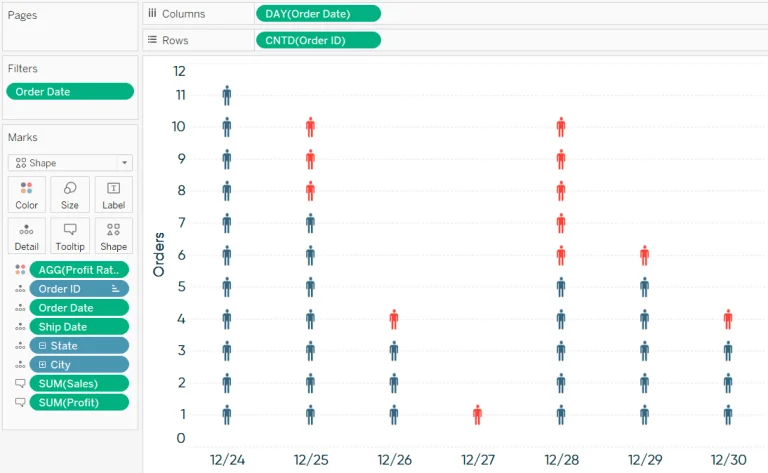

Tableau Training on
Tap Fast Track

Tableau Advanced Analyst

Tableau
Foundation

