During a recent project, I received an interesting question: “Can we swap what dimension is displayed in a stacked bar chart based on a filter being applied?” I’ve decided it would be easier for me to answer this question by showing you how to do it with the Superstore data. Below, we have a stacked bar chart displaying percent of total sales by departments within regions:
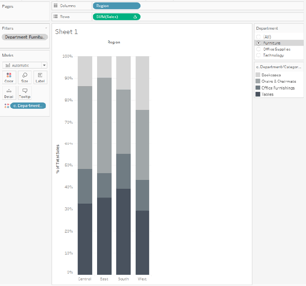

Tableau Training on
Tap Fast Track

Tableau Advanced Analyst

Tableau
Foundation

