The Principal of Playfair Data is back with another excellent how to article. Ryan Sleeper guides you through how to make ranged dot plots in Tableau. A ranged dot plot is great for identifying which regions have generated more sales within your business over a 12-month window.
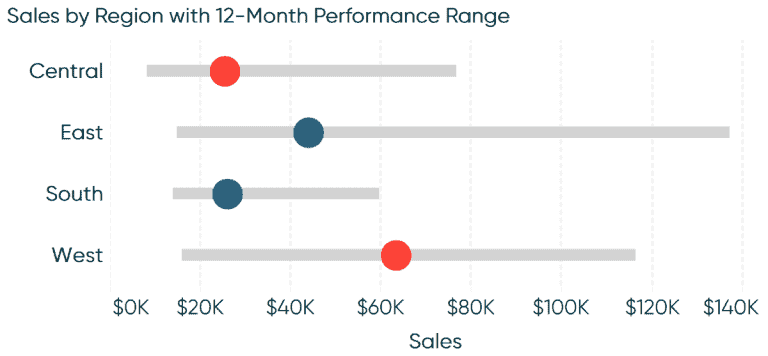

Tableau Training on
Tap Fast Track

Tableau Advanced Analyst

Tableau
Foundation

