STYLE YOUR KPIS – DISPLAYING POSITIVE OR NEGATIVE CHANGE

Want to Get Latest Updates and Tips on Tableau Bites Blogs

a94bf417 bc31 42a6 b008 13f164931cab

Want to make your KPIs stand out? The Data School’s Joe Stokes demonstrates how to style your KPIs in Tableau to display positive or negative change. This can be incredibly useful for businesses who want to look at if the number of sales or orders has increased or decreased year-on-year.
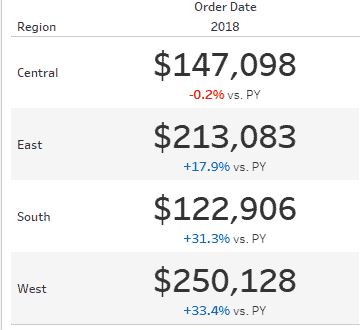
Read Original Article…

Share This Post:

001 database

Tableau Training on
Tap Fast Track

data scientist 1

Tableau Advanced Analyst

002 bar chart

Tableau
Foundation

003 network

Tableau Training
on Tap

Share :

Leave a Comment

Your email address will not be published. Required fields are marked *