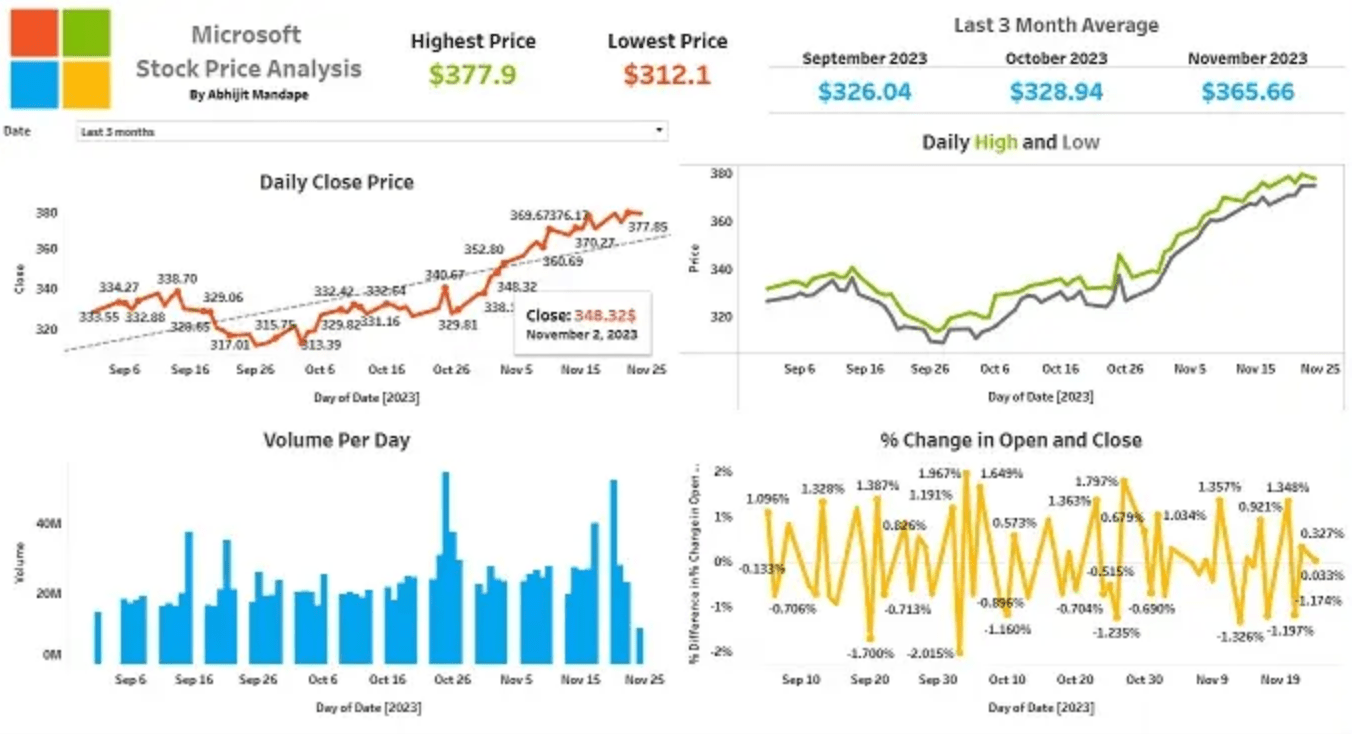
Here is an excellent resource, by Abhijit for both beginners and experienced users looking to enhance their data visualisation skills. It showcases Tableau’s capabilities to transform complex stock market data into easy-to-understand visuals, empowering you to make informed decisions. Whether you’re a stock market enthusiast or a data analyst looking to improve your skills, this articel s a valuable guide that will help you navigate the world of stocks with ease and precision. An enriching read!
Analysing Microsoft Stock Prices with Tableau
Want to Get Latest Updates and Tips on Tableau Bites Blogs
Sign Up For Newsletter


