
by Steve Adams | Oct 8, 2026 | Tableau-bites
Dreamforce 2026 introduced Tableau Studio as the next step for Tableau Desktop. Arend Verschueren of Biztory sets out what it actually is: one live workspace where you can describe a dashboard in plain language and let the agent draft it, then take over with...
by Steve Adams | Oct 8, 2026 | Tableau-bites
Eric Parker tackles a common pain: extracts that take an age to generate on your own machine. In this video he shows an old-school method in three steps. First, create an empty extract quickly on your desktop. Next, publish that extract to Tableau Cloud or Tableau...

by Steve Adams | Oct 8, 2026 | Tableau-bites
Martynas Jočys argues that the first job of dashboard design is guiding the eye, and making it look good comes second. He starts from Ben Shneiderman’s mantra, overview first, zoom and filter, details on demand, then shows how layout and the Z and F reading...

by Steve Adams | Oct 7, 2026 | Tableau-bites
Rafael Guevara pulls every licence plate reader camera in Texas from OpenStreetMap’s Overpass API and turns 16,750 points into a Tableau dashboard. One parameter switches between a density map, a custom shape map and a dual-layer map with city totals. He gives...
by Steve Adams | Oct 7, 2026 | Tableau-bites
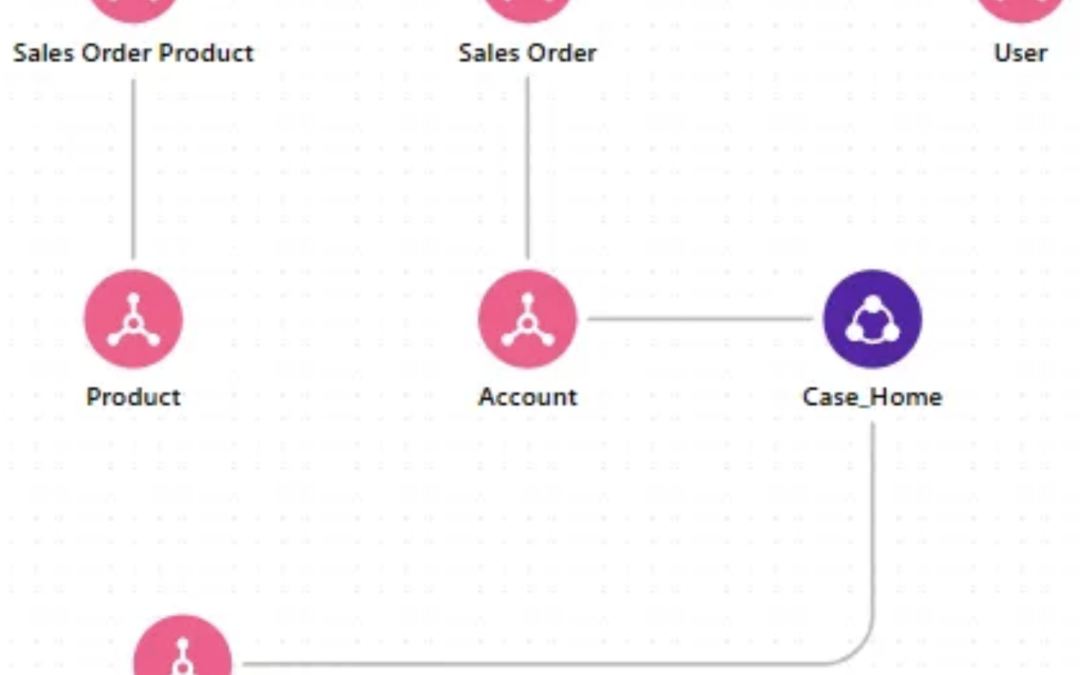
In Tableau Desktop you would reach for a table calculation. In Tableau Next, Ramdosk shows, YoY belongs in the semantic model. This walkthrough explains three modelling decisions first: why Order Item to Order Header is many-to-one, why revenue is calculated at the...
