BEYOND “SHOW ME” PART 1: IT’S ALL ABOUT THE X & Y

Want to Get Latest Updates and Tips on Tableau Bites Blogs

a91bf2b3 1f87 4cc3 a8b5 a35a3eb09146

This is part 1 of a 2 part series on going beyond the charts available in the “Show Me” panel in Tableau by Ken Flerlage. He goes into detail about just how versatile the simple XY (or scatter) plot can be.
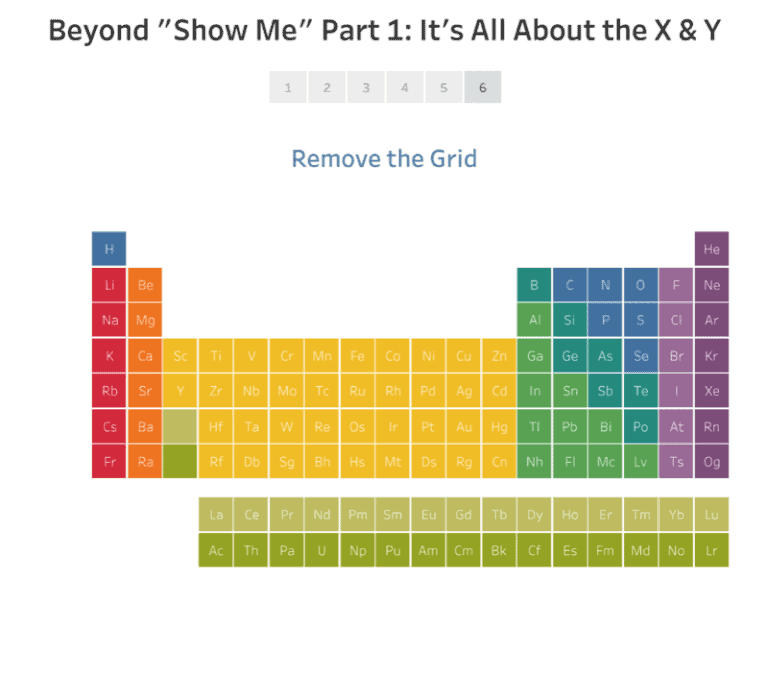
Read Original Article…

Share This Post:

001 database

Tableau Training on
Tap Fast Track

data scientist 1

Tableau Advanced Analyst

002 bar chart

Tableau
Foundation

003 network

Tableau Training
on Tap

Share :

Leave a Comment

Your email address will not be published. Required fields are marked *