The blog post on Donna Coles’ page details the process of creating a heat map using bathymetry lines. She introduces the concept of integrating bathymetry or contour lines, which are typically used in topographic mapping to indicate elevation, into heat maps for a more detailed and visually striking representation of data. She demonstrates how to set up the basic structure and colouring of the heat map. This innovative approach offers a new perspective on data visualisation, presenting opportunities for more nuanced and sophisticated data analysis.
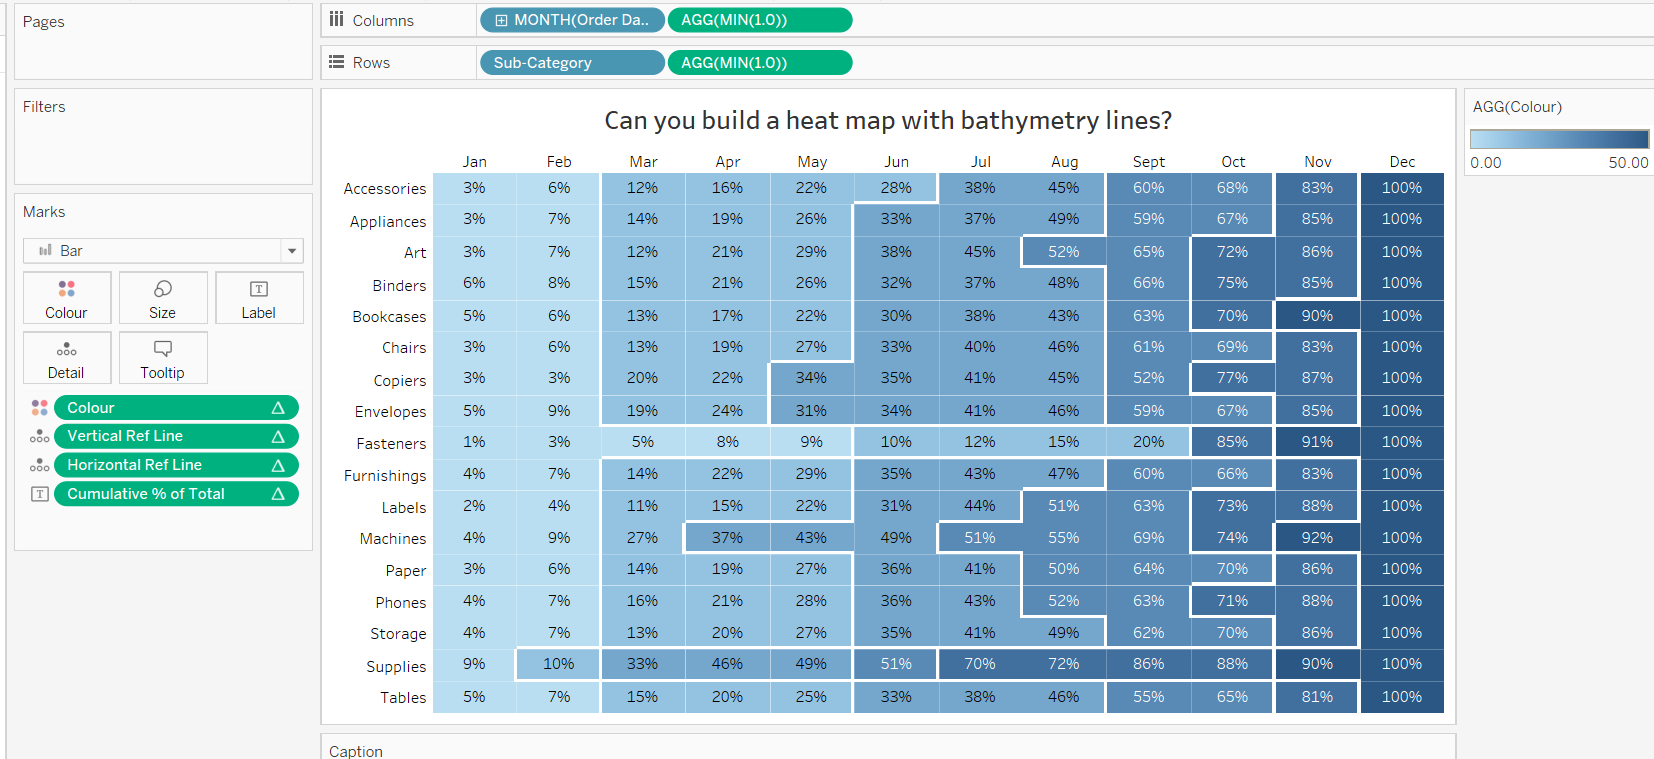

Tableau Training on
Tap Fast Track

Tableau Advanced Analyst

Tableau
Foundation

