Top 15 LOD Expressions By Bethany Lyons
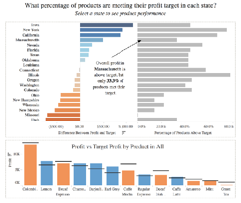
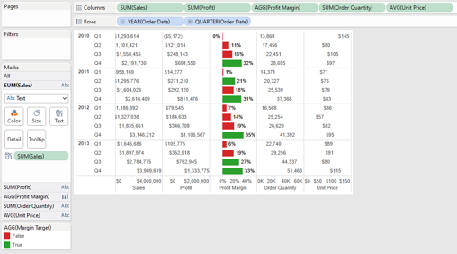
LOD Expressions provide a way to easily compute aggregations that are not at the level of detail of the visualization. You can then integrate those values within visualizations in arbitrary…
LOD Expressions provide a way to easily compute aggregations that are not at the level of detail of the visualization. You can then integrate those values within visualizations in arbitrary…
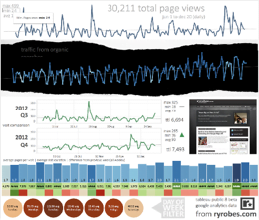
This is one of my all time favs, though I think I hadn’t really used it until after going to TCC13 and seeing Ryan Robitaille’s presentation on “The Art and Science of
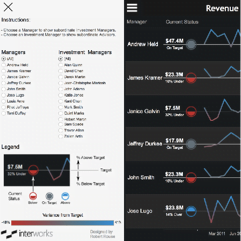
Some of my favorite mobile apps like Slack, Feedly and Google Maps have a slide-out menu that appears when I tap a small icon. That common design element makes plenty
Creating a Collapsing Menu Container By Robert Rouse Read More »
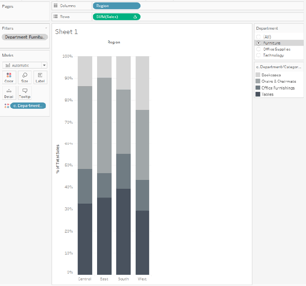
During a recent project, I received an interesting question: “Can we swap what dimension is displayed in a stacked bar chart based on a filter being applied?” I’ve decided it
Drilling through data based upon filter selection By Rick Thomas Read More »
Many of us found +Tableau Software from the work that we do in our day jobs, and have since taken our passions to our free time. When given the ability
My Favorite Tableau Trick For Work: MIN(1)By Dan Montgomery Read More »
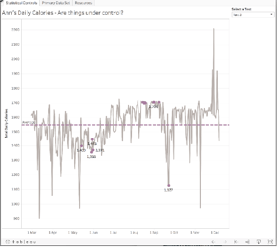
I’ve had this idea for a while now – create a blog post and video tutorial discussing what Statistical Process Control is and how to use different Control Chart “tests”
Statistical Process Control Charts By Ann Jackson Read More »
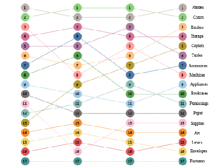
In this article we will see how to construct a rank/bump chart in Tableau. A rank chart is an effective way to see how the rank of our dimensions varied
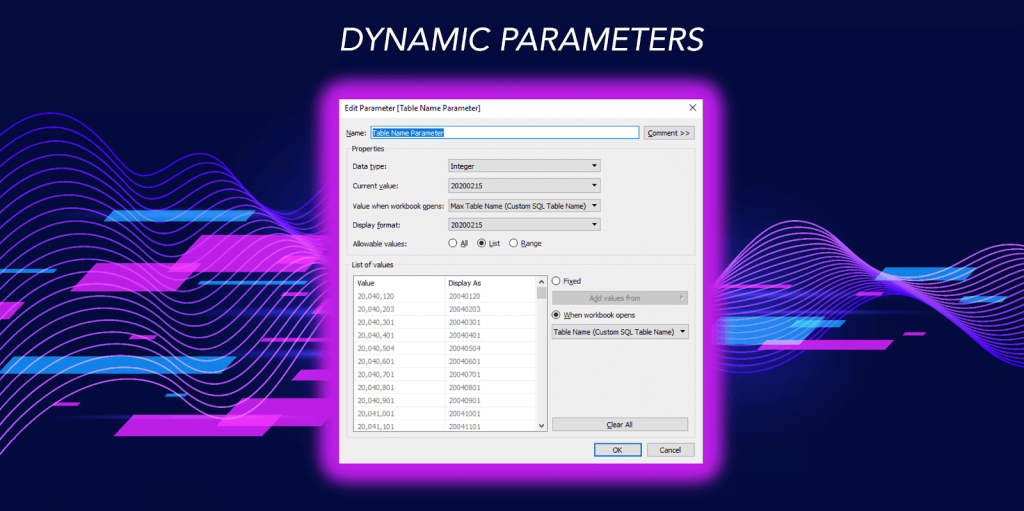
With the release of Tableau 2020.1. Dynamic Parameters are now available in Tableau. Zen Master Kevin Flerlage takes you through the keys to using Dynamic Parameters and it’s use cases.
THE KEY TO DYNAMIC PARAMETERS & SOME GOOD USE CASES Read More »
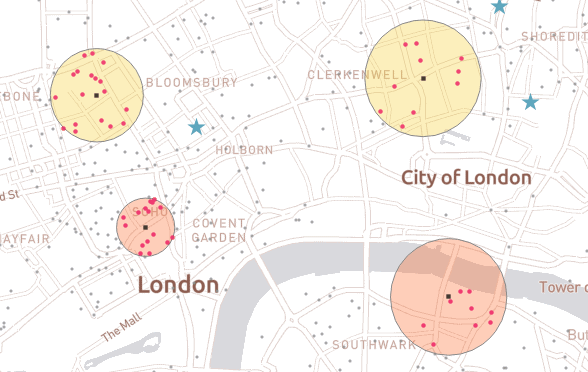
If Dynamic Parameters was not enough to whet your appetite, another new feature that has emerged in Tableau 2020.1 is the introduction of the Buffer Spatial Calculation for mapping. Zen
Andy Kriebel is back with another useful Tableau tip up his sleeve as he shows you how to deselect marks on a worksheet with a Highlight Action. For this tip,
Deselect Marks with a Highlight Action By Andy Kriebel Read More »
