In this article we will see how to construct a rank/bump chart in Tableau. A rank chart is an effective way to see how the rank of our dimensions varied across year.
Lets suppose we rank each of the sub category in our Super store data and would like to see if the ranking of these sub categories by sales changed over time or remained constant. A rank chart comes to our rescue for this.
Lets go ahead and create a Rank chart that helps us to show the rank of the Sub Categories has changed across year.
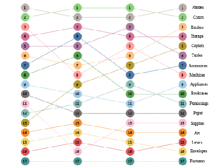

Tableau Training on
Tap Fast Track

Tableau Advanced Analyst

Tableau
Foundation

