
5 KEY LEARNINGS FOR DATA DESIGNERS
The Tableau Research and Design team presents their initial findings from an eye-tracking study. Read Original Article…
The Tableau Research and Design team presents their initial findings from an eye-tracking study. Read Original Article…
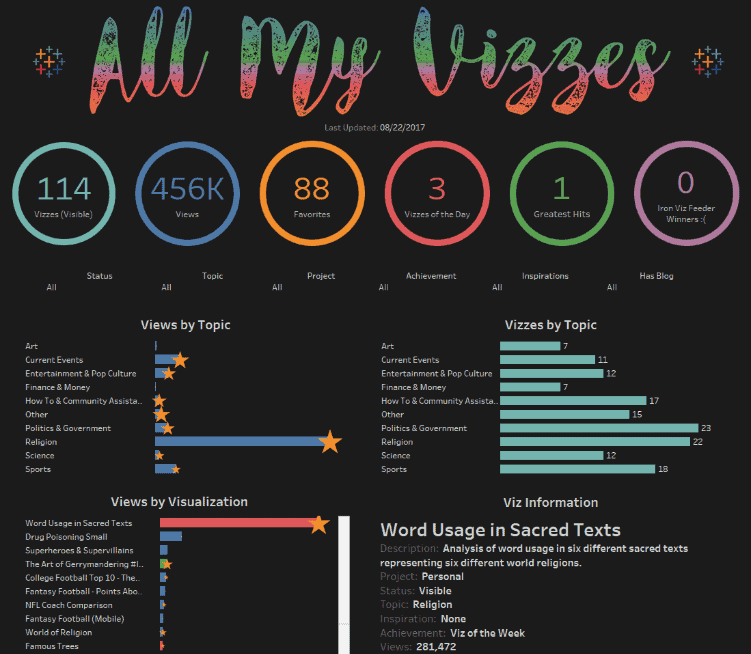
Ken Flerlage has been posting Tableau Public dashboards for a while now and thought he’d summarise some off them. Some interesting samples of work – don’t forget to browse the
Just in case you missed it, the latest version was released this month. Take a look at some of the new features. Read Original Article…
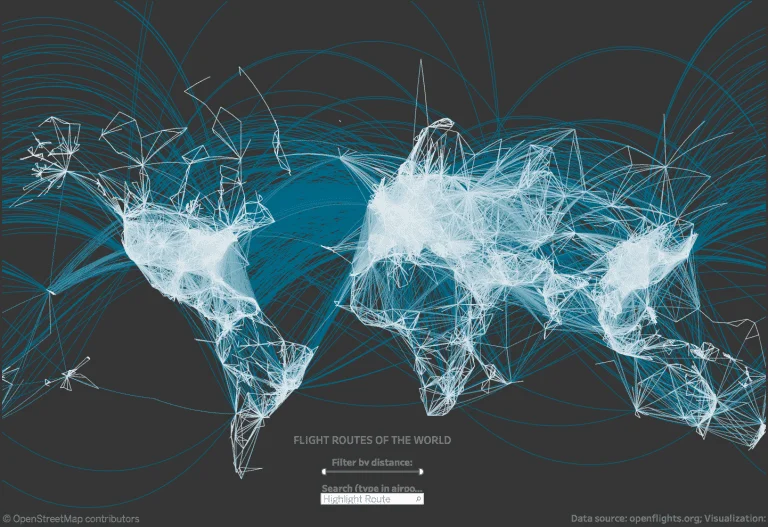
The spatial file connector now also supports linear geographies allowing infrastructure networks to be easily plotted. Read Original Article…

Ryan Sleeper shows how to dynamically group everything outside the Top N into “Others” to maintain 100% of the data in a visualisation. Read Original Article…
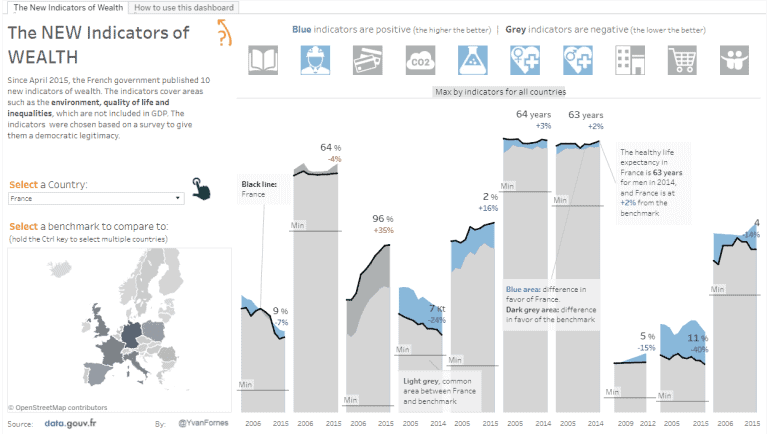
Yvan Fornes tells how to perform benchmark analysis against the total population, or a subset of the data. Read Original Article…
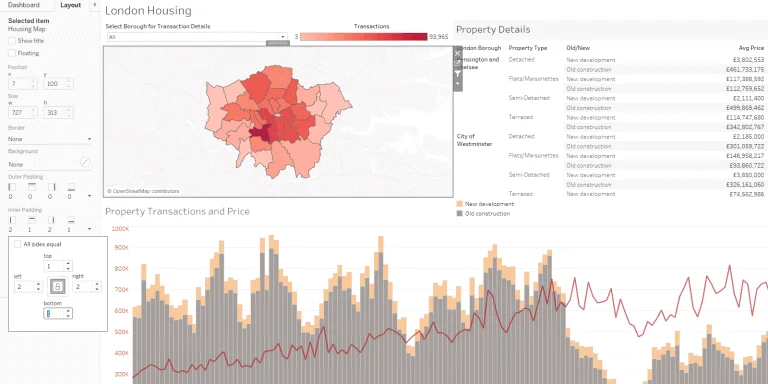
Elena Hristozova tells us she used to hate Tableau’s dashboard containers. These tips are intended to help you learn to love them. Read Original Article…
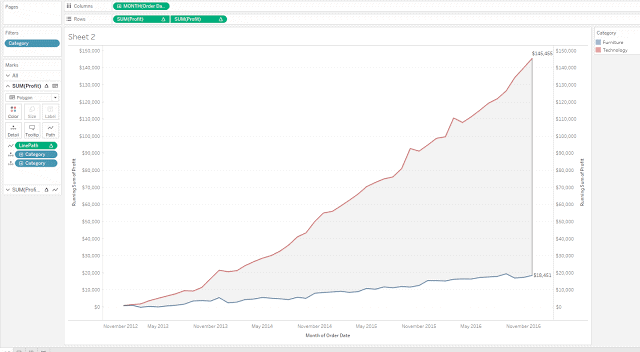
Rody Zakovich provides several ways to shade between two lines Tableau. Read More
Up until v10.3, tooltips just provided information. Now users can make selections and filters straight from the tooltip, in the flow. Read Original Article…

If your organization is still wondering whether to upgrade to Tableau 10, this independent overview of the latest features may be of interest. Read More
TABLEAU 10: A RADICAL OVERHAUL AIMS TO KEEP TABLEAU AT THE FOREFRONT OF THE PACK Read More »