Steve Wexler talks through how to visualise both filtered and non-filtered results in the same view. This has many use cases and is well worth reading through his example using survey data.
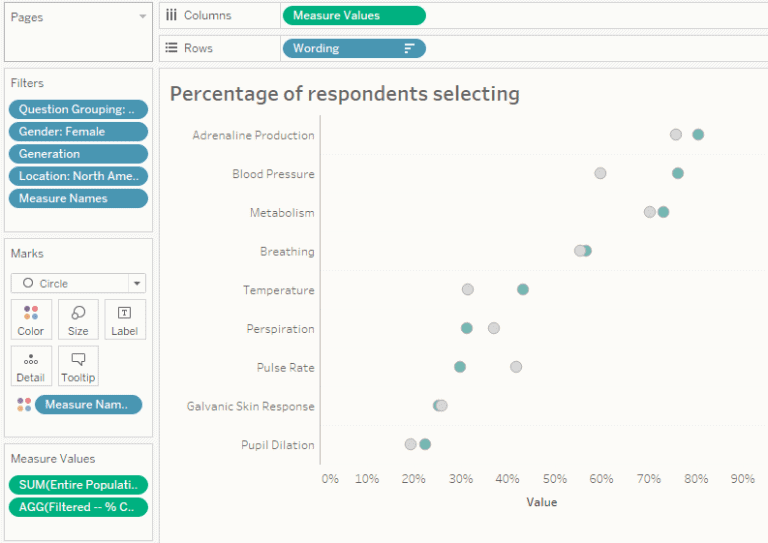

Tableau Training on
Tap Fast Track

Tableau Advanced Analyst

Tableau
Foundation

