Creating Animated Line Charts in Tableau

Want to Get Latest Updates and Tips on Tableau Bites Blogs

Picture 3

“I recently participated inthe #30DayChartChallenge and one of the daily topics was animation, for which I created the below visualisation with a series of animated lines under the map…” This post by Marc Reid highlights some steps to follow…
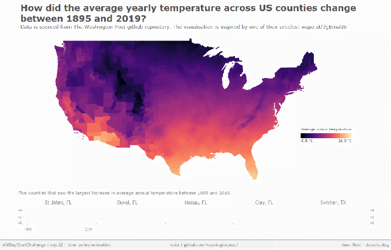
Read Original Article…

Share This Post:

001 database

Tableau Training on
Tap Fast Track

data scientist 1

Tableau Advanced Analyst

002 bar chart

Tableau
Foundation

003 network

Tableau Training
on Tap

Share :

Leave a Comment

Your email address will not be published. Required fields are marked *