Donut charts aren’t everybody’s cup of tea, but I quite like them for showing a percentage against a total which has to be 100%. Things like the percentage of
tickets answered within an hour, or an industrial test pass rate as a percentage, or an on time percentage.The problem is that percentages often come with targets. If you’re measuring a rate, you’re probably measuring it to check that you’re on target. For example, if you’ve got 19.8% of tickets being answered within an hour, you’ve probably also got a target of 15% or 20% or something, and you’d probably want to show that on your donut chart for context, like this:
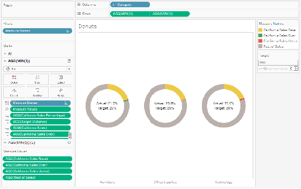
Donut charts and dynamic reference banding By Gwilym Lockwood
Want to Get Latest Updates and Tips on Tableau Bites Blogs
Sign Up For Newsletter