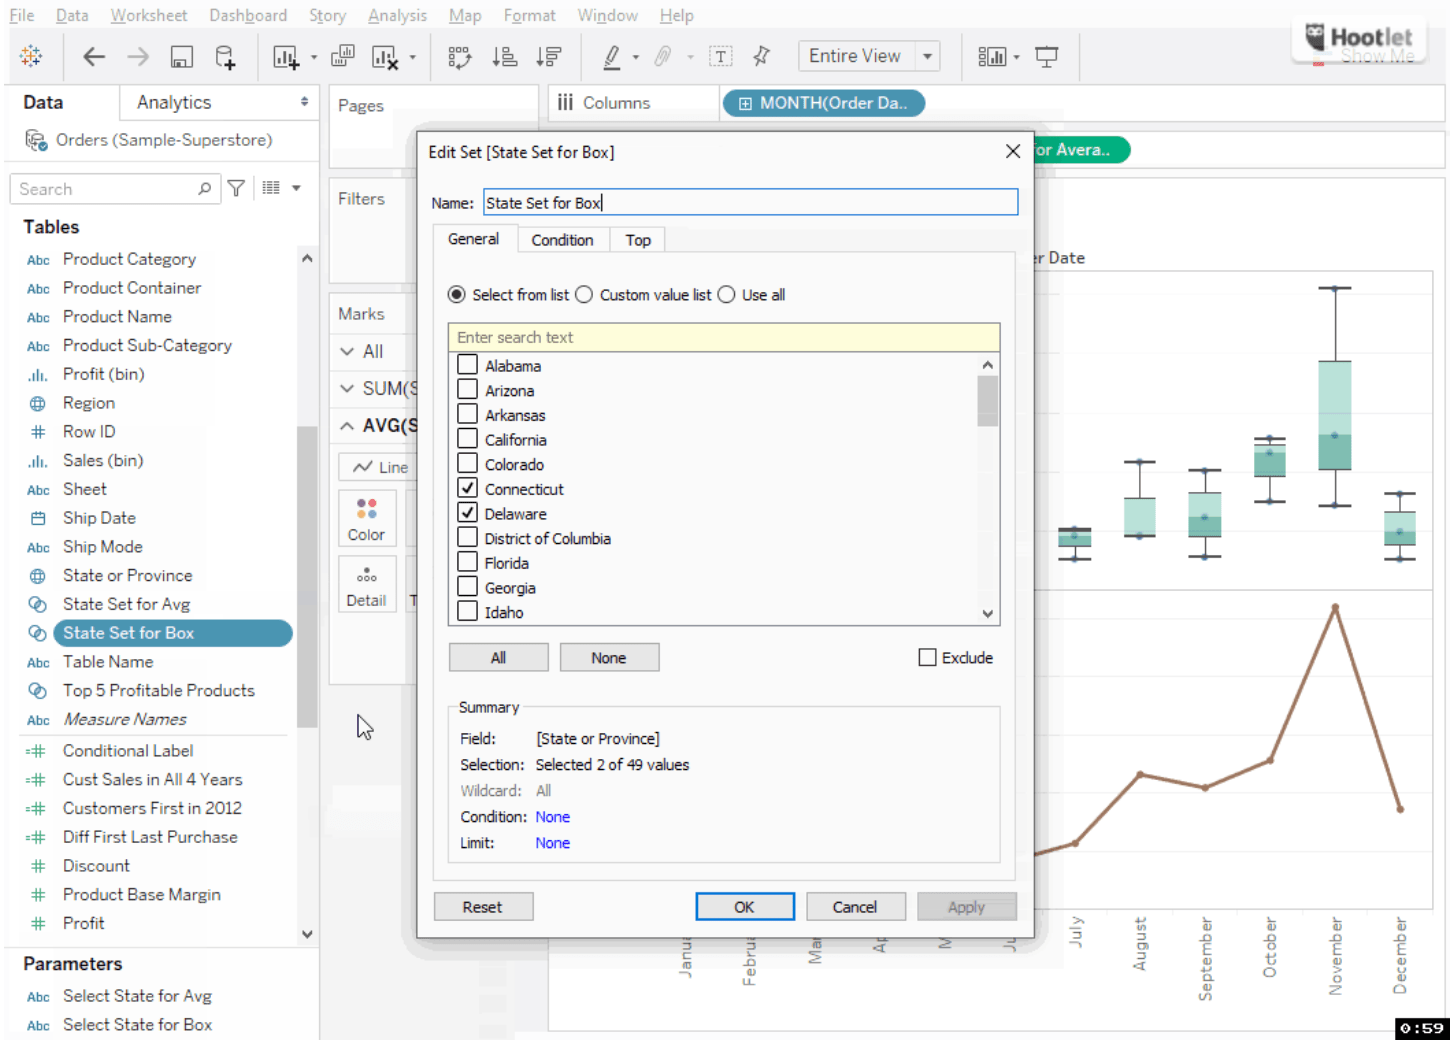
The post, on learntableau.technology uses a practical example from the Sample Superstore dataset, demonstrating how to find total sales over all the years for each state using a Box and whisker chart, alongside the average sales over all the years for each state using a Line chart. This hands-on approach helps make the concept more tangible and easier to apply in your own projects. So whether you’re just starting out with Tableau or are an experienced user looking to upskill, this post is an invaluable resource that will take your data visualisation skills to the next level. Don’t miss out!
How to add Unique Filters to Multiple Charts in the Same Page in Tableau
Want to Get Latest Updates and Tips on Tableau Bites Blogs
Sign Up For Newsletter


