HOW TO BUILD A SANKEY DIAGRAM WITHOUT ANY DATA PREP BEFOREHAND

Want to Get Latest Updates and Tips on Tableau Bites Blogs

cac74423 0e96 418e 8239 d76b03067a0a

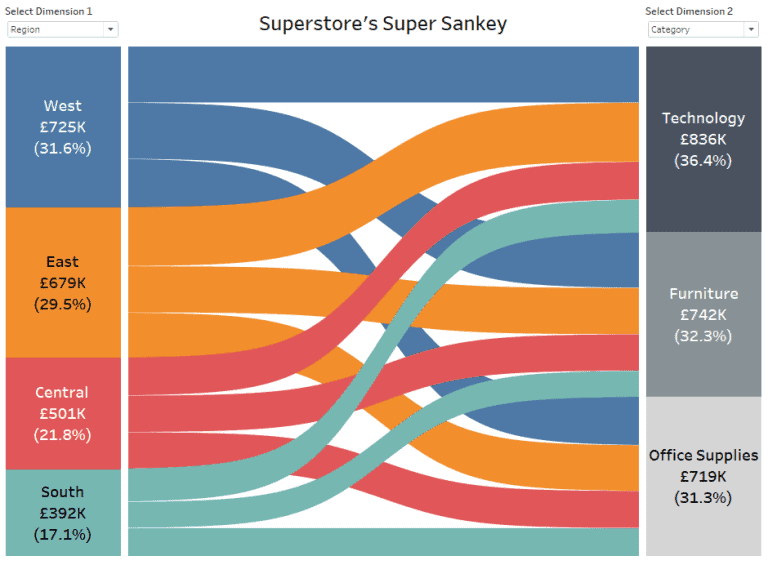
Sankey diagrams show the proportional “flow” (or make up) of one dimension from (or within) another.

Ian Baldwin of The Information Lab takes us through his 20-step process to create a Sankey without having to prepare the data before getting into Tableau – which would normally increase the data set as a bi-product. Well worth the effort in my opinion.

Read Original Article…

Share This Post:

001 database

Tableau Training on
Tap Fast Track

data scientist 1

Tableau Advanced Analyst

002 bar chart

Tableau
Foundation

003 network

Tableau Training
on Tap

Share :

Leave a Comment

Your email address will not be published. Required fields are marked *