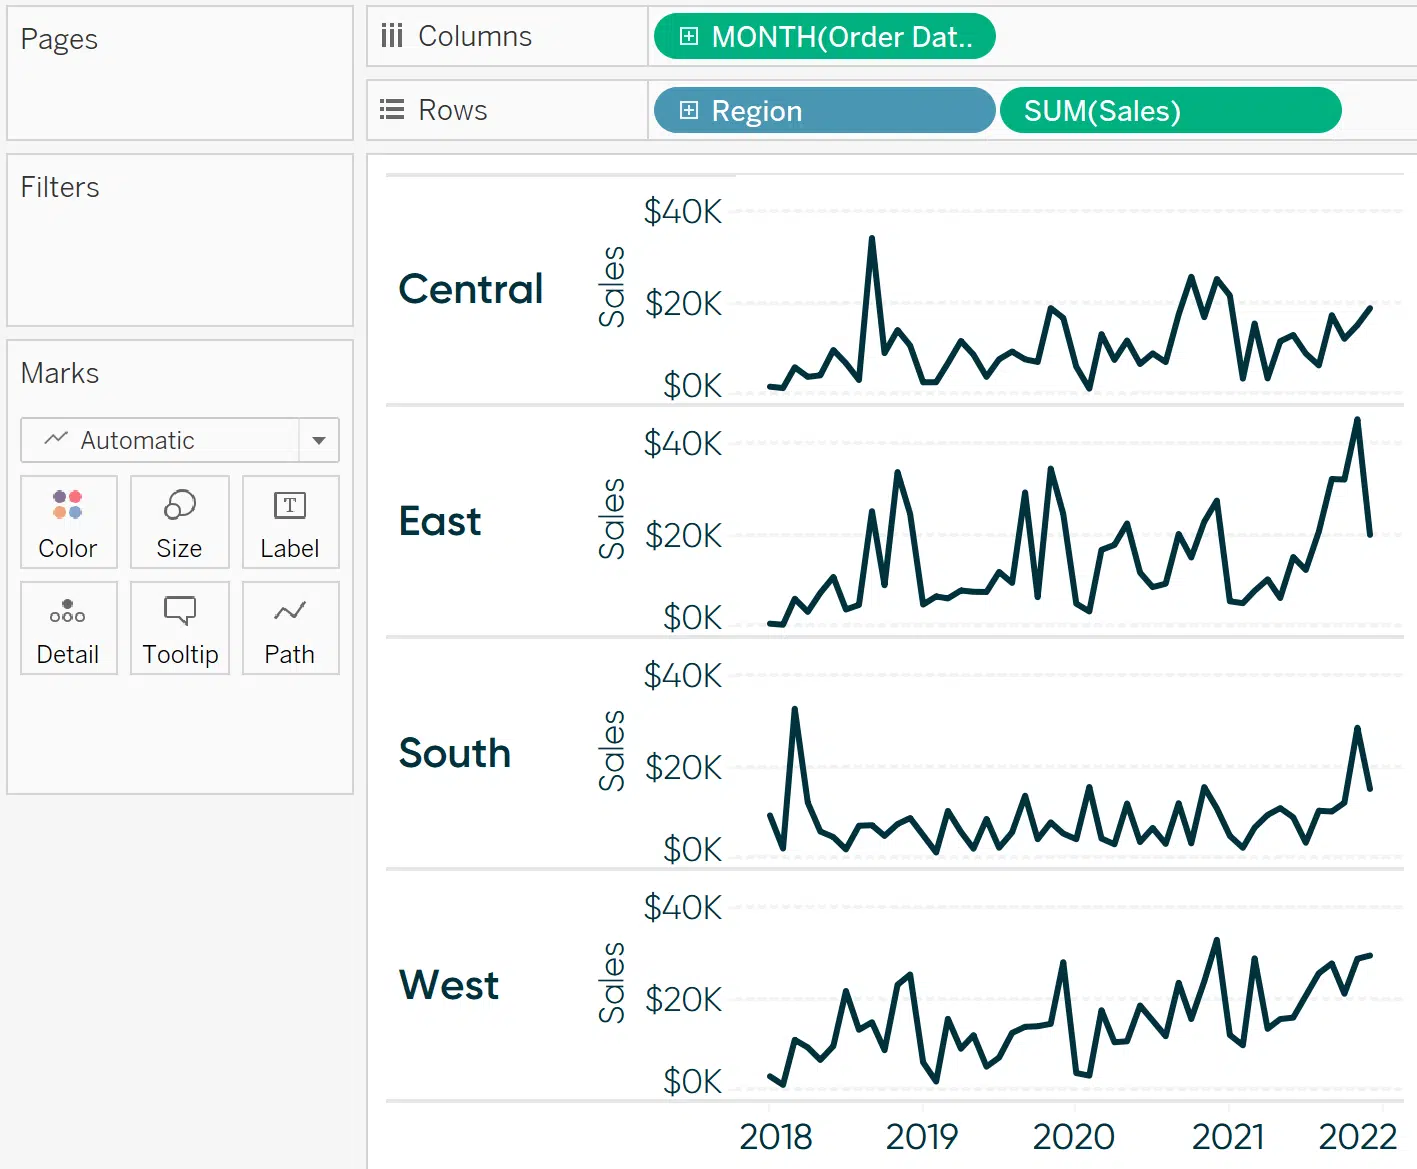
“By the end of this post, you will be able to color each row (or column) in a chart based on whether the most recent performance was positive or negative” Continue reading on with Ryan Sleeper.
How to Color Entire Tableau Charts Based on Latest Performance
Want to Get Latest Updates and Tips on Tableau Bites Blogs
Sign Up For Newsletter


