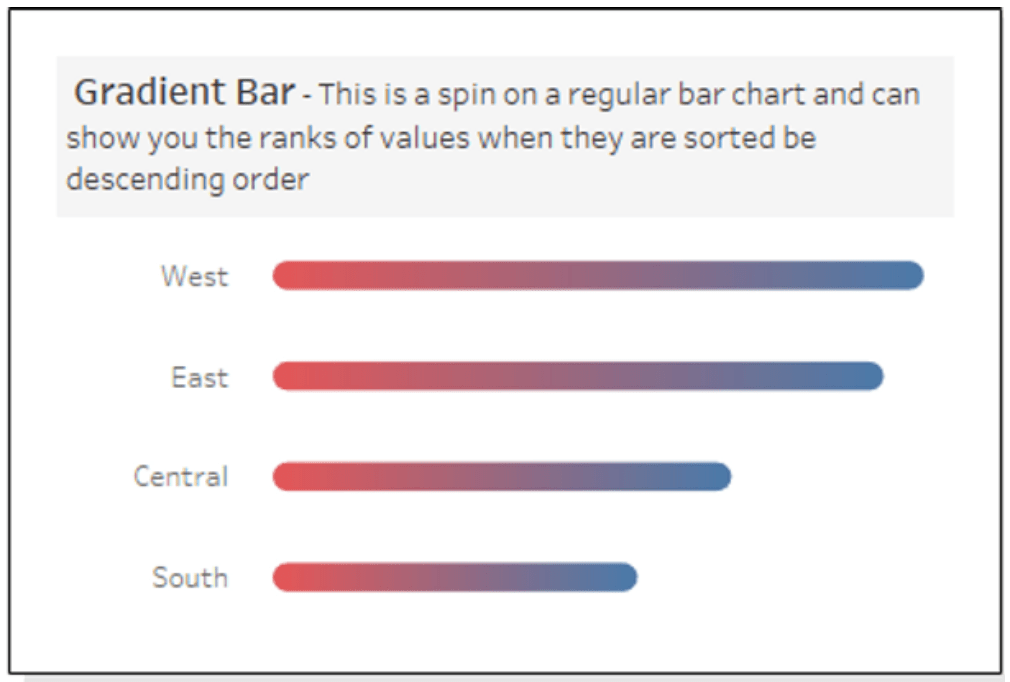
This blog post from Dawn Harrington serves as a concise guide to crafting gradient bar charts using Tableau. Dawn clearly outlines the importance of effective data visualisation and introduces readers to the process of creating compelling bar charts in Tableau. Don’t miss out on this treasure trove of information from Dawn!
How to Create a Gradient Bar Chart
Want to Get Latest Updates and Tips on Tableau Bites Blogs
Sign Up For Newsletter


