In my training sessions, I warn people about using filled maps for data insights due to the possible issues of visual skewing.
In this article Sarah Battersby shows you how to overcome this with either square or hexagonal representation of geographical data. A great read, and its easier than you may think!
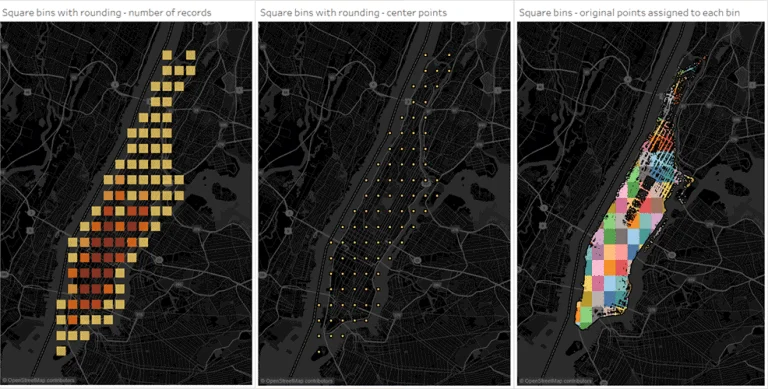

Tableau Training on
Tap Fast Track

Tableau Advanced Analyst

Tableau
Foundation

