Tableau Bites would not be the newsletter it is without having one of Ryan Sleeper’s excellent how-to articles. Ryan introduces a new chart in Tableau, the leapfrog chart, which are a variation of a minimalist dot plot that allows the user to focus on the performance of one element in a dimension against the others and the overall average.
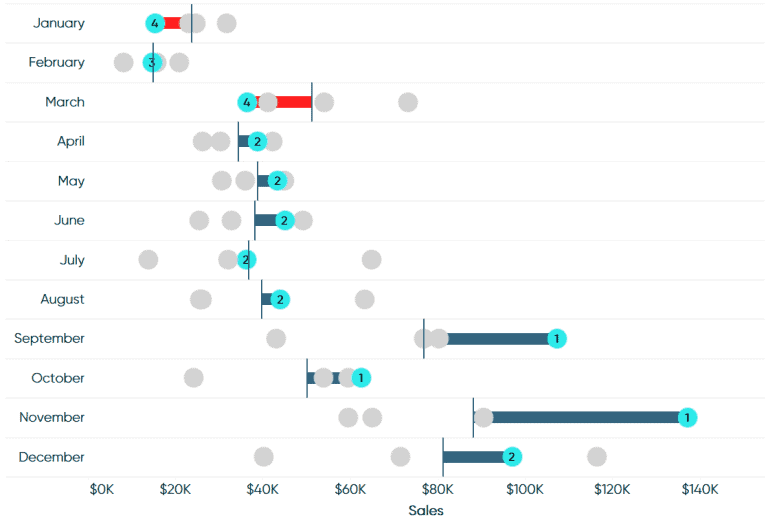

Tableau Training on
Tap Fast Track

Tableau Advanced Analyst

Tableau
Foundation

